
- Startseite >
- Flüsse >
- Chemie >
- Isar >
- Staudach Messstation >
- Jahresgrafik

Jahresgrafik Staudach Messstation / Tiroler Achen
Daten vom 2014-12-12 bis zum 2015-12-11
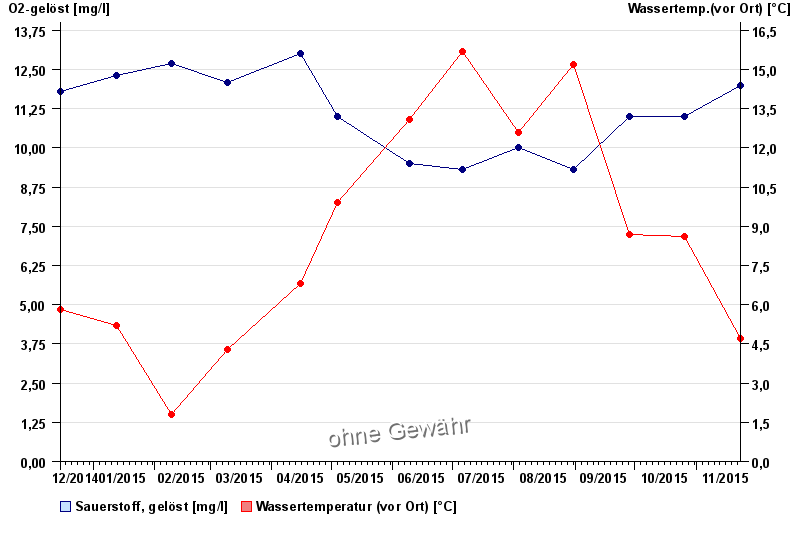
| Datum | O2-gelöst [mg/l] | Wassertemp.(vor Ort) [°C] |
|---|---|---|
| 23.11.2015 | 12 | 4,7 |
| 26.10.2015 | 11 | 8,6 |
| 28.09.2015 | 11 | 8,7 |
| 31.08.2015 | 9,3 | 15,2 |
| 03.08.2015 | 10 | 12,6 |
| 06.07.2015 | 9,3 | 15,7 |
| 09.06.2015 | 9,5 | 13,1 |
© Bayerisches Landesamt für Umwelt 2024