
- Startseite >
- Flüsse >
- Abfluss >
- Regnitz >
- Seemannsmühle >
- Jahresgrafik

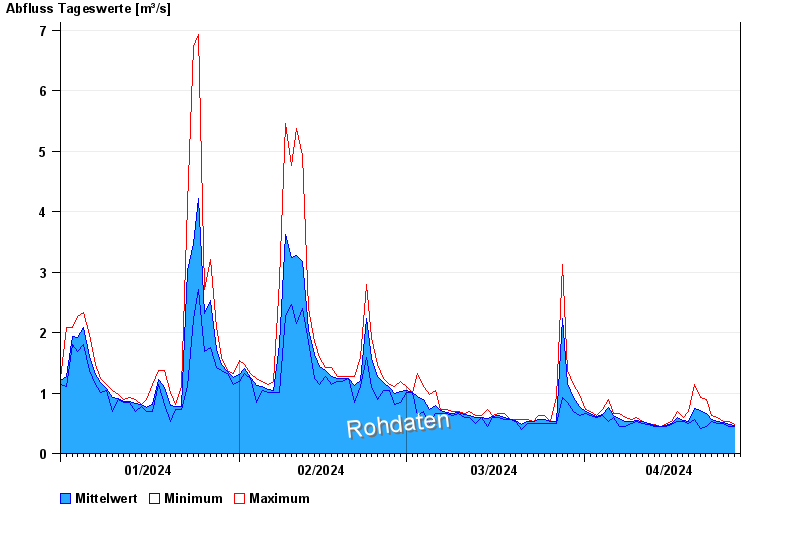
Jahresgrafik Seemannsmühle / Schwäbische Rezat
Abfluss vom 01.01.2024 bis zum 27.04.2024
| Datum | Mittelwert [m³/s] | Maximum [m³/s] | Minimum [m³/s] |
|---|---|---|---|
| 27.04.2024 | 0,472 | 0,472 | 0,472 |
| 26.04.2024 | 0,483 | 0,53 | 0,444 |
| 25.04.2024 | 0,512 | 0,53 | 0,503 |
| 24.04.2024 | 0,531 | 0,595 | 0,503 |
| 23.04.2024 | 0,564 | 0,628 | 0,53 |
| 22.04.2024 | 0,66 | 0,887 | 0,444 |
| 21.04.2024 | 0,708 | 0,926 | 0,416 |
© Bayerisches Landesamt für Umwelt 2024