
- Startseite >
- Flüsse >
- Abfluss >
- Regnitz >
- Behringersmühle >
- Jahresgrafik

Jahresgrafik Behringersmühle / Wiesent
Abfluss vom 29.11.2023 bis zum 28.11.2024
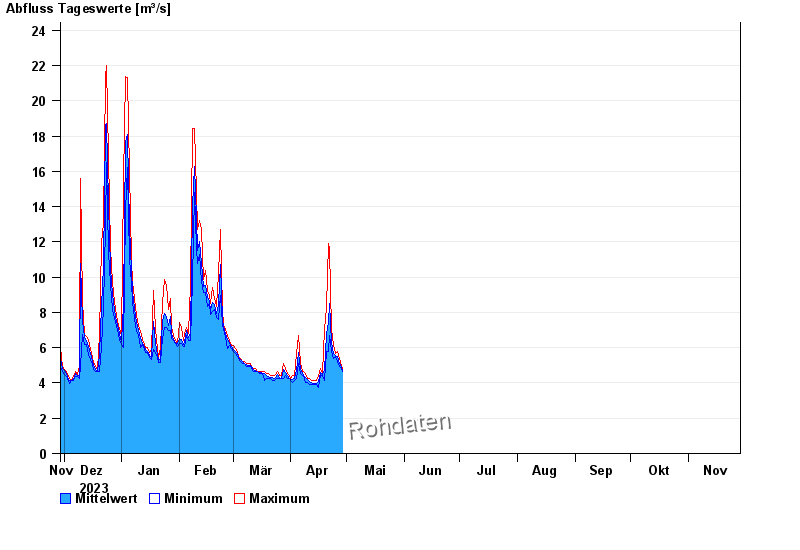
| Datum | Mittelwert [m³/s] | Maximum [m³/s] | Minimum [m³/s] |
|---|---|---|---|
| 21.06.2024 | 3,77 | 3,77 | 3,77 |
| 20.06.2024 | 3,86 | 3,89 | 3,77 |
| 19.06.2024 | 3,84 | 4,01 | 3,77 |
| 18.06.2024 | 3,88 | 4,01 | 3,64 |
| 17.06.2024 | 4 | 4,01 | 3,89 |
| 16.06.2024 | 4,15 | 4,4 | 3,89 |
| 15.06.2024 | 4,26 | 4,53 | 4,01 |
© Bayerisches Landesamt für Umwelt 2024