
- Startseite >
- Flüsse >
- Abfluss >
- Untere Donau >
- Wallersdorf >
- Jahresgrafik

Jahresgrafik Wallersdorf / Reißingerbach
Abfluss vom 27.10.2020 bis zum 26.10.2021
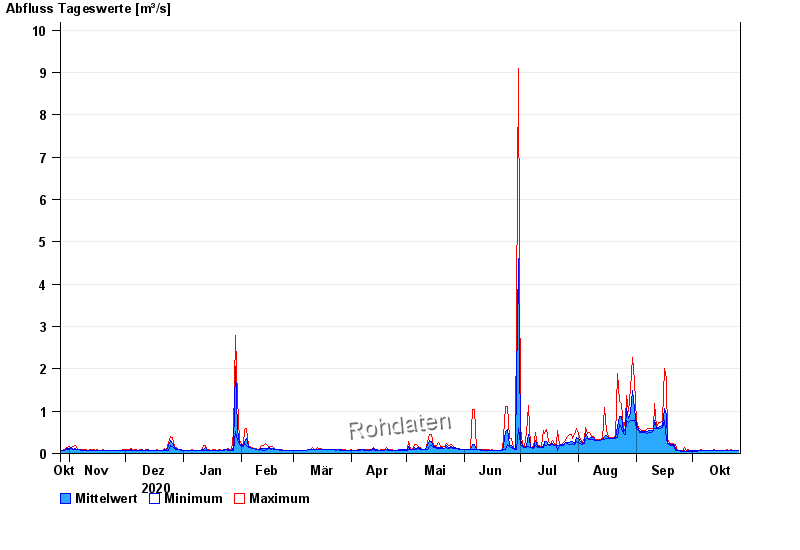
| Datum | Mittelwert [m³/s] | Maximum [m³/s] | Minimum [m³/s] |
|---|---|---|---|
| 26.10.2021 | 0,076 | 0,081 | 0,074 |
| 25.10.2021 | 0,075 | 0,081 | 0,074 |
| 24.10.2021 | 0,071 | 0,074 | 0,068 |
| 23.10.2021 | 0,074 | 0,081 | 0,074 |
| 22.10.2021 | 0,079 | 0,088 | 0,074 |
| 21.10.2021 | 0,076 | 0,081 | 0,074 |
| 20.10.2021 | 0,072 | 0,088 | 0,068 |
© Bayerisches Landesamt für Umwelt 2024