
- Startseite >
- Flüsse >
- Abfluss >
- Untere Donau >
- Wallersdorf >
- Jahresgrafik

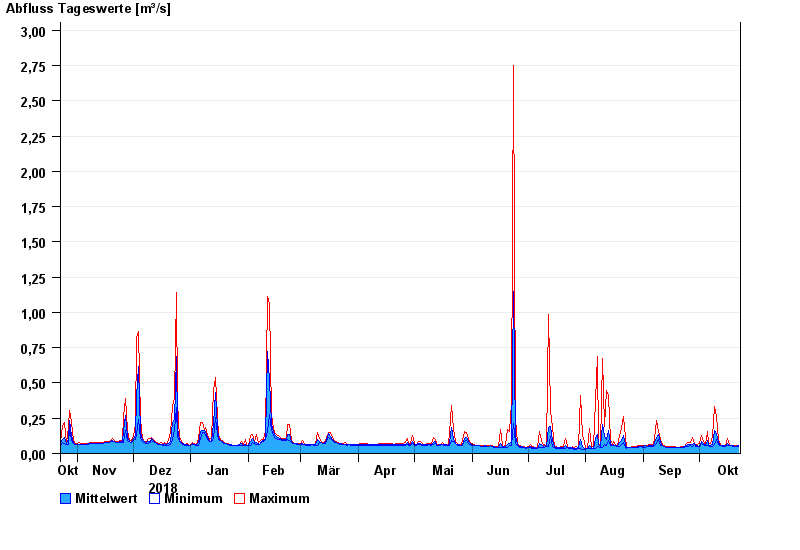
Jahresgrafik Wallersdorf / Reißingerbach
Abfluss vom 23.10.2018 bis zum 22.10.2019
| Datum | Mittelwert [m³/s] | Maximum [m³/s] | Minimum [m³/s] |
|---|---|---|---|
| 22.10.2019 | 0,055 | 0,059 | 0,05 |
| 21.10.2019 | 0,052 | 0,059 | 0,05 |
| 20.10.2019 | 0,05 | 0,054 | 0,05 |
| 19.10.2019 | 0,054 | 0,06 | 0,05 |
| 18.10.2019 | 0,055 | 0,056 | 0,055 |
| 17.10.2019 | 0,058 | 0,061 | 0,056 |
| 16.10.2019 | 0,068 | 0,109 | 0,056 |
© Bayerisches Landesamt für Umwelt 2024