
- Startseite >
- Flüsse >
- Abfluss >
- Untere Donau >
- Wallersdorf >
- Jahresgrafik

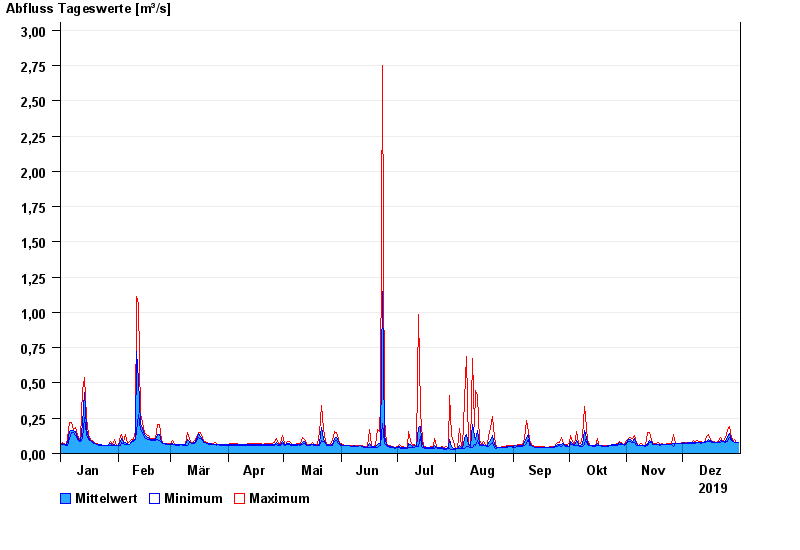
Jahresgrafik Wallersdorf / Reißingerbach
Abfluss vom 01.01.2019 bis zum 31.12.2019
| Datum | Mittelwert [m³/s] | Maximum [m³/s] | Minimum [m³/s] |
|---|---|---|---|
| 31.12.2019 | 0,076 | 0,076 | 0,076 |
| 30.12.2019 | 0,076 | 0,077 | 0,076 |
| 29.12.2019 | 0,081 | 0,098 | 0,077 |
| 28.12.2019 | 0,085 | 0,091 | 0,083 |
| 27.12.2019 | 0,099 | 0,116 | 0,091 |
| 26.12.2019 | 0,143 | 0,188 | 0,116 |
| 25.12.2019 | 0,112 | 0,16 | 0,084 |
© Bayerisches Landesamt für Umwelt 2024