
- Startseite >
- Flüsse >
- Abfluss >
- Untere Donau >
- Wallersdorf >
- Jahresgrafik

Jahresgrafik Wallersdorf / Reißingerbach
Abfluss vom 01.01.2024 bis zum 10.05.2024
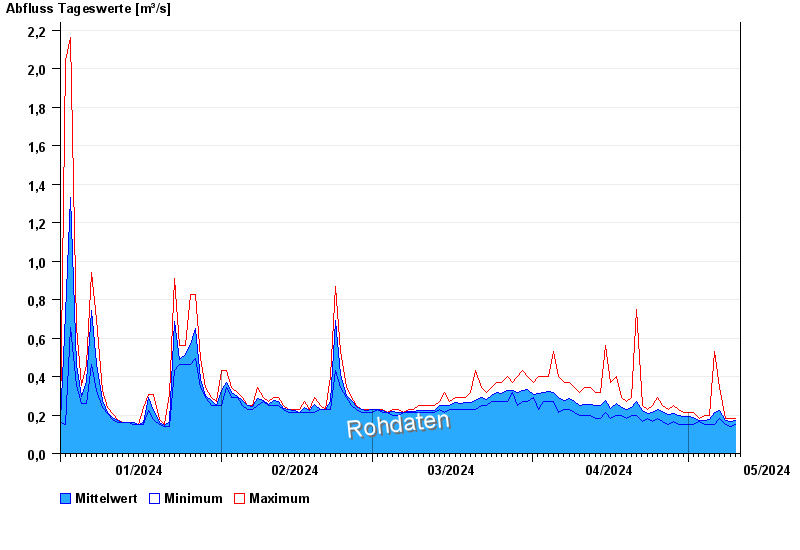
| Datum | Mittelwert [m³/s] | Maximum [m³/s] | Minimum [m³/s] |
|---|---|---|---|
| 10.05.2024 | 0,168 | 0,181 | 0,166 |
| 09.05.2024 | 0,166 | 0,181 | 0,14 |
| 08.05.2024 | 0,169 | 0,181 | 0,152 |
| 07.05.2024 | 0,224 | 0,342 | 0,181 |
| 06.05.2024 | 0,215 | 0,528 | 0,152 |
| 05.05.2024 | 0,178 | 0,196 | 0,152 |
| 04.05.2024 | 0,174 | 0,196 | 0,152 |
© Bayerisches Landesamt für Umwelt 2024