
- Startseite >
- Flüsse >
- Abfluss >
- Naab - Regen >
- Schlehenmühle >
- Jahresgrafik

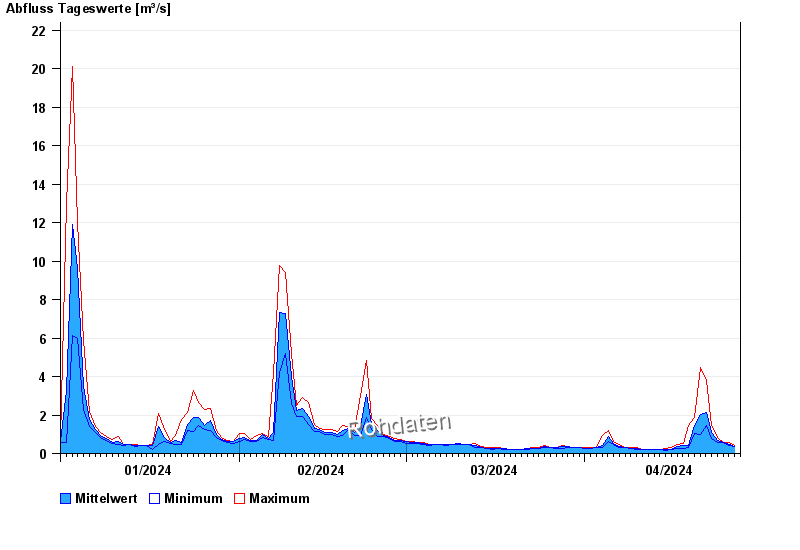
Jahresgrafik Schlehenmühle / Roter Main
Abfluss vom 01.01.2024 bis zum 27.04.2024
| Datum | Mittelwert [m³/s] | Maximum [m³/s] | Minimum [m³/s] |
|---|---|---|---|
| 27.04.2024 | 0,413 | 0,413 | 0,413 |
| 26.04.2024 | 0,477 | 0,549 | 0,413 |
| 25.04.2024 | 0,555 | 0,596 | 0,549 |
| 24.04.2024 | 0,69 | 0,848 | 0,596 |
| 23.04.2024 | 1,08 | 1,45 | 0,797 |
| 22.04.2024 | 2,11 | 3,81 | 1,45 |
| 21.04.2024 | 2,05 | 4,49 | 1 |
© Bayerisches Landesamt für Umwelt 2024