
- Startseite >
- Flüsse >
- Abfluss >
- Unterer Main >
- Gollmuthhausen >
- Jahresgrafik

Jahresgrafik Gollmuthhausen / Milz
Abfluss vom 29.07.2021 bis zum 28.07.2022
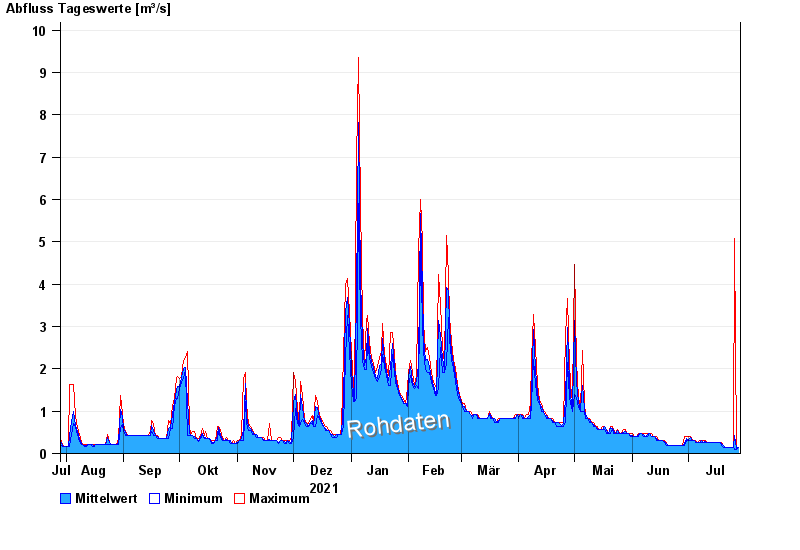
| Datum | Mittelwert [m³/s] | Maximum [m³/s] | Minimum [m³/s] |
|---|---|---|---|
| 28.07.2022 | 0,144 | 0,144 | 0,144 |
| 27.07.2022 | 0,129 | 0,144 | 0,104 |
| 26.07.2022 | 0,418 | 5,07 | 0,104 |
| 25.07.2022 | 0,144 | 0,144 | 0,144 |
| 24.07.2022 | 0,144 | 0,144 | 0,144 |
| 23.07.2022 | 0,144 | 0,144 | 0,144 |
| 22.07.2022 | 0,144 | 0,144 | 0,144 |
© Bayerisches Landesamt für Umwelt 2024