
- Startseite >
- Flüsse >
- Abfluss >
- Unterer Main >
- Gollmuthhausen >
- Jahresgrafik

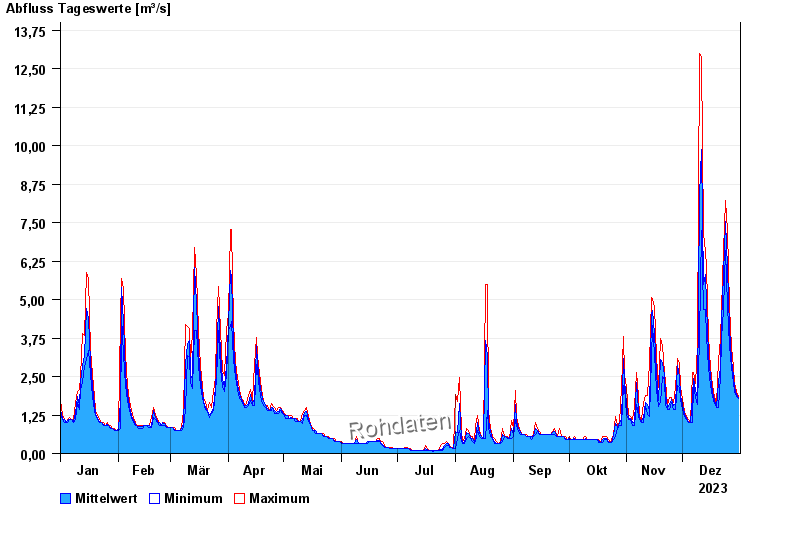
Jahresgrafik Gollmuthhausen / Milz
Abfluss vom 01.01.2023 bis zum 31.12.2023
| Datum | Mittelwert [m³/s] | Maximum [m³/s] | Minimum [m³/s] |
|---|---|---|---|
| 31.12.2023 | 1,8 | 1,86 | 1,79 |
| 30.12.2023 | 1,91 | 2 | 1,86 |
| 29.12.2023 | 2,14 | 2,29 | 2 |
| 28.12.2023 | 2,51 | 2,79 | 2,29 |
| 27.12.2023 | 3,05 | 3,44 | 2,79 |
| 26.12.2023 | 4,06 | 4,77 | 3,51 |
| 25.12.2023 | 6,04 | 7,24 | 4,77 |
© Bayerisches Landesamt für Umwelt 2024