
- Startseite >
- Flüsse >
- Abfluss >
- Obere Donau >
- Schwabach >
- Monatsgrafik

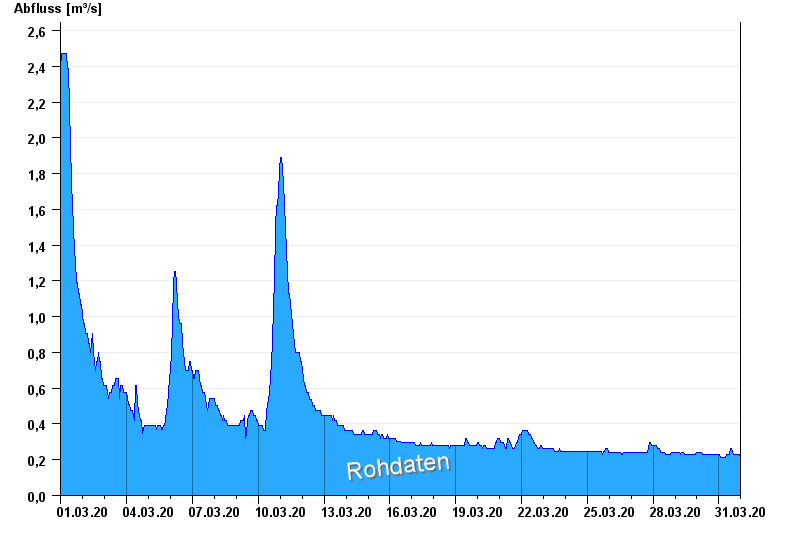
Monatsgrafik Schwabach / Schwabach
Abfluss vom 01.03.2020 bis zum 31.03.2020
| Datum | Abfluss [m³/s] |
|---|---|
| 01.04.2020 00:45 | 0,212 |
| 01.04.2020 00:30 | 0,212 |
| 01.04.2020 00:15 | 0,212 |
| 01.04.2020 00:00 | 0,212 |
| 31.03.2020 23:45 | 0,212 |
| 31.03.2020 23:30 | 0,212 |
| 31.03.2020 23:15 | 0,212 |
© Bayerisches Landesamt für Umwelt 2024