
- Startseite >
- Flüsse >
- Abfluss >
- Obere Donau >
- Roth Bleiche >
- Jahresgrafik

Jahresgrafik Roth Bleiche / Roth
Abfluss vom 30.03.2024 bis zum 29.03.2025
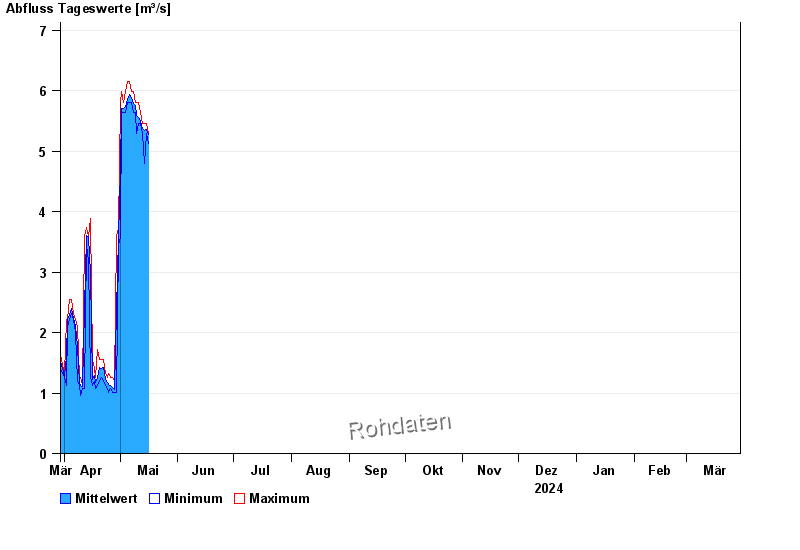
| Datum | Mittelwert [m³/s] | Maximum [m³/s] | Minimum [m³/s] |
|---|---|---|---|
| 29.04.2024 | 1,77 | 3,59 | 1,01 |
| 28.04.2024 | 1,06 | 1,19 | 1,01 |
| 27.04.2024 | 1,09 | 1,26 | 1,01 |
| 26.04.2024 | 1,12 | 1,26 | 1,07 |
| 25.04.2024 | 1,14 | 1,33 | 1,01 |
| 24.04.2024 | 1,18 | 1,26 | 1,07 |
| 23.04.2024 | 1,23 | 1,33 | 1,13 |
© Bayerisches Landesamt für Umwelt 2024