
- Startseite >
- Flüsse >
- Abfluss >
- Obere Donau >
- Roth Bleiche >
- Jahresgrafik

Jahresgrafik Roth Bleiche / Roth
Abfluss vom 24.07.2019 bis zum 23.07.2020
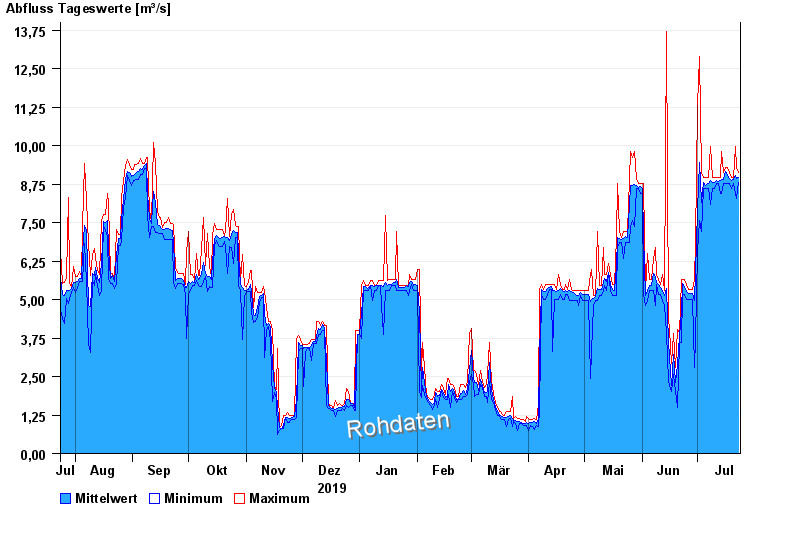
| Datum | Mittelwert [m³/s] | Maximum [m³/s] | Minimum [m³/s] |
|---|---|---|---|
| 23.07.2020 | 8,97 | 9,13 | 8,79 |
| 22.07.2020 | 8,93 | 9,3 | 8,27 |
| 21.07.2020 | 9,03 | 9,98 | 8,44 |
| 20.07.2020 | 8,9 | 8,96 | 8,78 |
| 19.07.2020 | 8,87 | 8,96 | 8,61 |
| 18.07.2020 | 8,93 | 9,13 | 8,78 |
| 17.07.2020 | 9,03 | 9,3 | 8,78 |
© Bayerisches Landesamt für Umwelt 2024