
- Startseite >
- Flüsse >
- Abfluss >
- Obere Donau >
- Eschelbach Q >
- Jahresgrafik

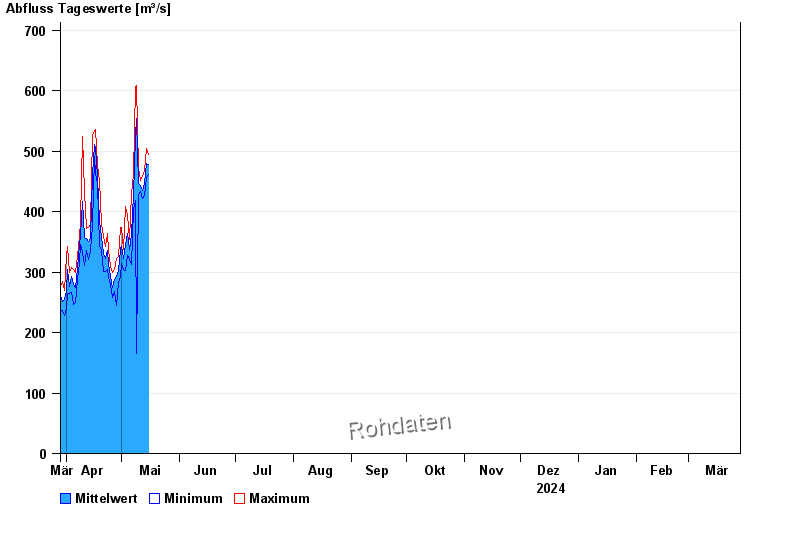
Jahresgrafik Eschelbach Q / Inn
Abfluss vom 29.03.2024 bis zum 28.03.2025
 Für diesen Pegel sind keine -Sommer hinterlegt.
| Datum | Mittelwert [m³/s] | Maximum [m³/s] | Minimum [m³/s] |
|---|---|---|---|
| 16.05.2024 | 488 | 519 | 469 |
| 15.05.2024 | 477 | 494 | 458 |
| 14.05.2024 | 479 | 505 | 457 |
| 13.05.2024 | 446 | 468 | 427 |
| 12.05.2024 | 435 | 458 | 421 |
| 11.05.2024 | 443 | 452 | 434 |
| 10.05.2024 | 446 | 471 | 428 |
© Bayerisches Landesamt für Umwelt 2024