
- Startseite >
- Flüsse >
- Abfluss >
- Isar >
- Wolnzach >
- Jahresgrafik

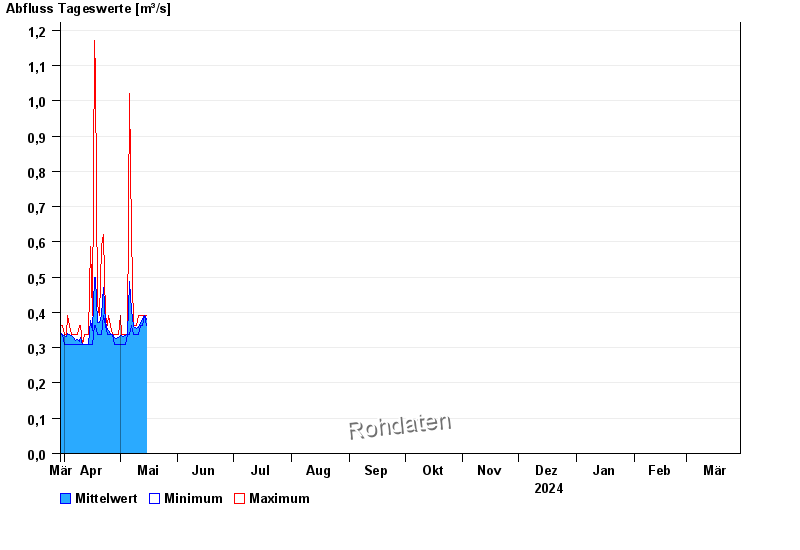
Jahresgrafik Wolnzach / Wolnzach
Abfluss vom 30.03.2024 bis zum 29.03.2025
 Für diesen Pegel sind keine Hauptwerte hinterlegt.
| Datum | Mittelwert [m³/s] | Maximum [m³/s] | Minimum [m³/s] |
|---|---|---|---|
| 29.05.2024 | 0,311 | 0,336 | 0,309 |
| 28.05.2024 | 0,455 | 0,872 | 0,309 |
| 27.05.2024 | 0,333 | 0,484 | 0,309 |
| 26.05.2024 | 0,36 | 0,392 | 0,336 |
| 25.05.2024 | 0,983 | 2,82 | 0,392 |
| 24.05.2024 | 0,507 | 4,26 | 0,364 |
| 23.05.2024 | 0,393 | 0,452 | 0,364 |
© Bayerisches Landesamt für Umwelt 2024