
- Startseite >
- Flüsse >
- Abfluss >
- Isar >
- Valley >
- Jahresgrafik

Jahresgrafik Valley / Mangfall
Abfluss vom 01.01.2024 bis zum 28.04.2024
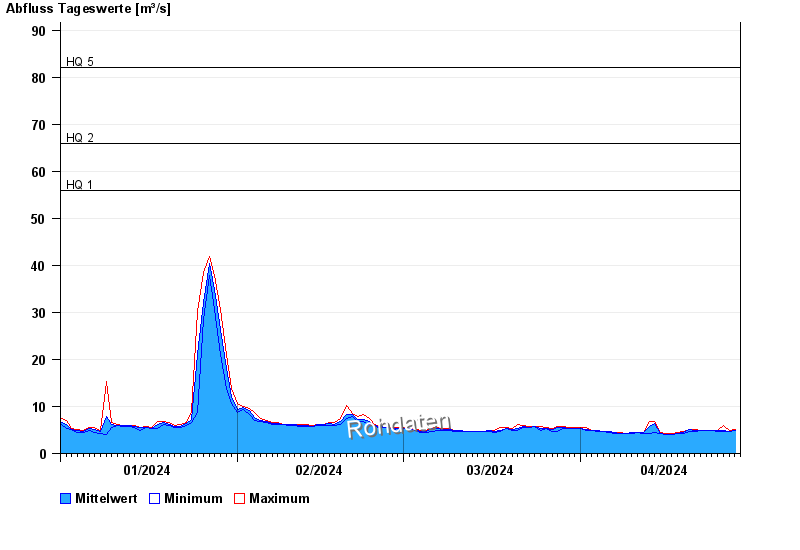
- HQ1 56 m³/s
- HQ2 66 m³/s
- HQ5 82 m³/s
- HQ10 98 m³/s
- HQ20 115 m³/s
- HQ50 140 m³/s
- HQ100 170 m³/s
| Datum | Mittelwert [m³/s] | Maximum [m³/s] | Minimum [m³/s] |
|---|---|---|---|
| 28.04.2024 | 4,72 | 4,72 | 4,72 |
| 27.04.2024 | 4,51 | 4,72 | 4,5 |
| 26.04.2024 | 4,72 | 5,69 | 4,5 |
| 25.04.2024 | 4,82 | 4,96 | 4,72 |
| 24.04.2024 | 4,96 | 4,96 | 4,96 |
| 23.04.2024 | 4,96 | 4,96 | 4,96 |
| 22.04.2024 | 4,96 | 4,96 | 4,96 |
© Bayerisches Landesamt für Umwelt 2024