
- Startseite >
- Flüsse >
- Abfluss >
- Isar >
- Freising >
- Jahresgrafik

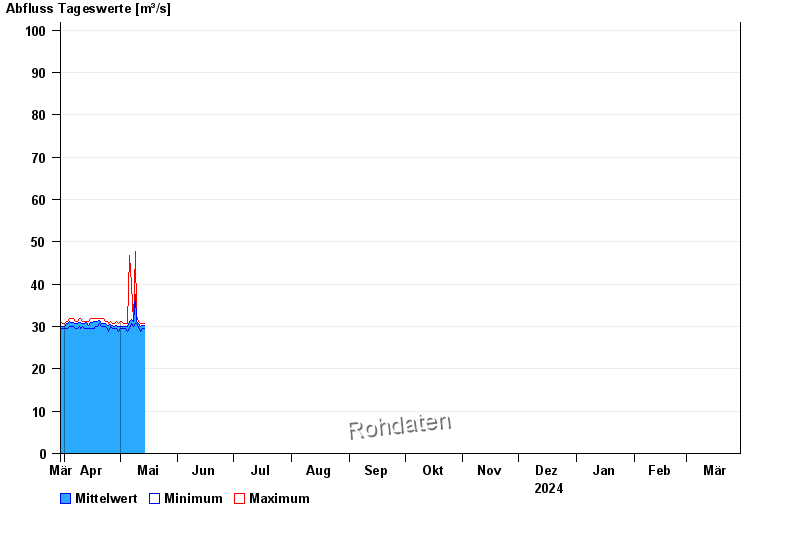
Jahresgrafik Freising / Isar
Abfluss vom 30.03.2024 bis zum 29.03.2025
- HQ5 550 m³/s
- HQ10 650 m³/s
- HQ20 750 m³/s
- HQ100 1050 m³/s
| Datum | Mittelwert [m³/s] | Maximum [m³/s] | Minimum [m³/s] |
|---|---|---|---|
| 29.04.2024 | 30,2 | 30,7 | 30,1 |
| 28.04.2024 | 30,1 | 30,7 | 29,5 |
| 27.04.2024 | 30,2 | 30,7 | 29,5 |
| 26.04.2024 | 30,5 | 31,3 | 30,1 |
| 25.04.2024 | 30,2 | 30,7 | 28,9 |
| 24.04.2024 | 30,3 | 31,3 | 29,5 |
| 23.04.2024 | 30,8 | 31,3 | 30,1 |
© Bayerisches Landesamt für Umwelt 2024