
- Startseite >
- Flüsse >
- Abfluss >
- Isar >
- Eschenlohe Brücke >
- Monatsgrafik

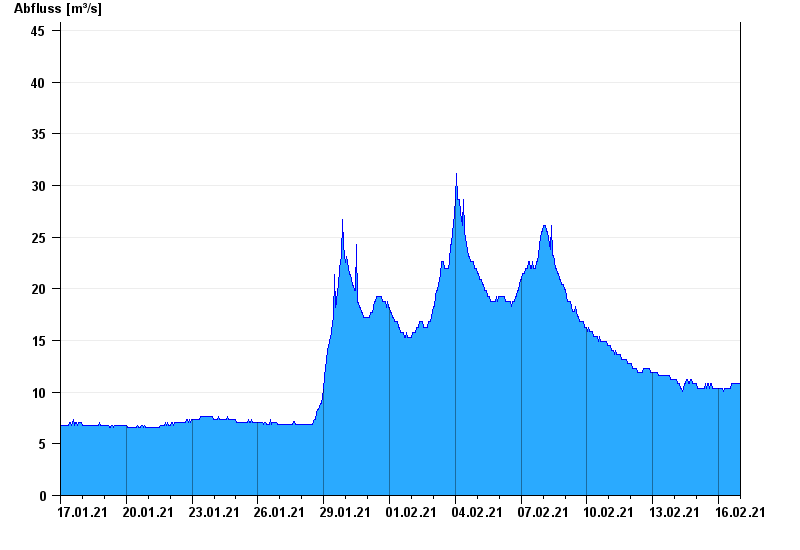
Monatsgrafik Eschenlohe Brücke / Loisach
Abfluss vom 17.01.2021 bis zum 16.02.2021
Hinweis
Messwerte beeinflusst durch Kraftwerkssteuerungen.
- 02.06.2013 Abfluss: 203 m³/s
- 31.08.2010 Abfluss: 177 m³/s
- 03.06.2010 Abfluss: 172 m³/s
- 14.07.2008 Abfluss: 108 m³/s
- 10.10.2011 Abfluss: 104 m³/s
| Datum | Abfluss [m³/s] |
|---|---|
| 16.02.2021 23:45 | 10,8 |
| 16.02.2021 23:30 | 10,8 |
| 16.02.2021 23:15 | 10,8 |
| 16.02.2021 23:00 | 10,8 |
| 16.02.2021 22:45 | 10,8 |
| 16.02.2021 22:30 | 10,8 |
| 16.02.2021 22:15 | 10,8 |
© Bayerisches Landesamt für Umwelt 2024