
- Startseite >
- Flüsse >
- Abfluss >
- Isar >
- Eschenlohe Brücke >
- Monatsgrafik

Monatsgrafik Eschenlohe Brücke / Loisach
Abfluss vom 01.06.2019 bis zum 30.06.2019
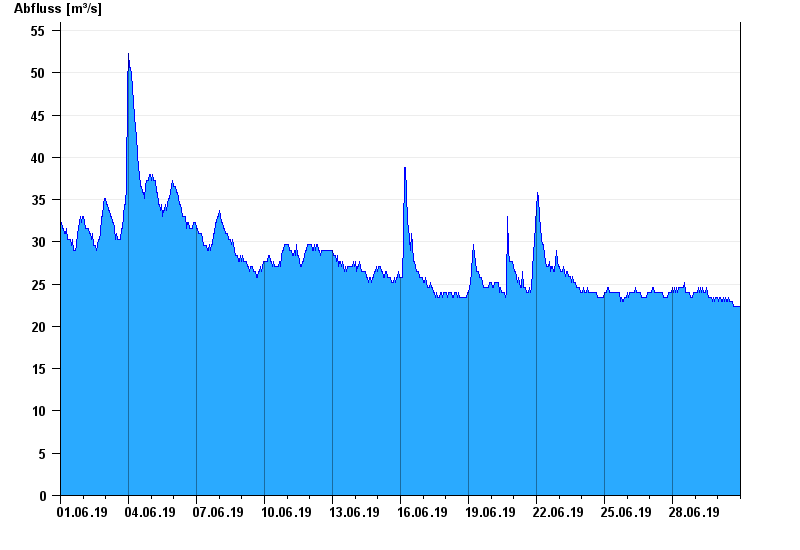
Hinweis
Messwerte beeinflusst durch Kraftwerkssteuerungen.
| Datum | Abfluss [m³/s] |
|---|---|
| 01.07.2019 00:45 | 22,3 |
| 01.07.2019 00:30 | 21,7 |
| 01.07.2019 00:15 | 22,3 |
| 01.07.2019 00:00 | 22,3 |
| 30.06.2019 23:45 | 22,3 |
| 30.06.2019 23:30 | 22,3 |
| 30.06.2019 23:15 | 22,3 |
© Bayerisches Landesamt für Umwelt 2024