
- Startseite >
- Flüsse >
- Abfluss >
- Isar >
- Eschelbach Q >
- Jahresgrafik

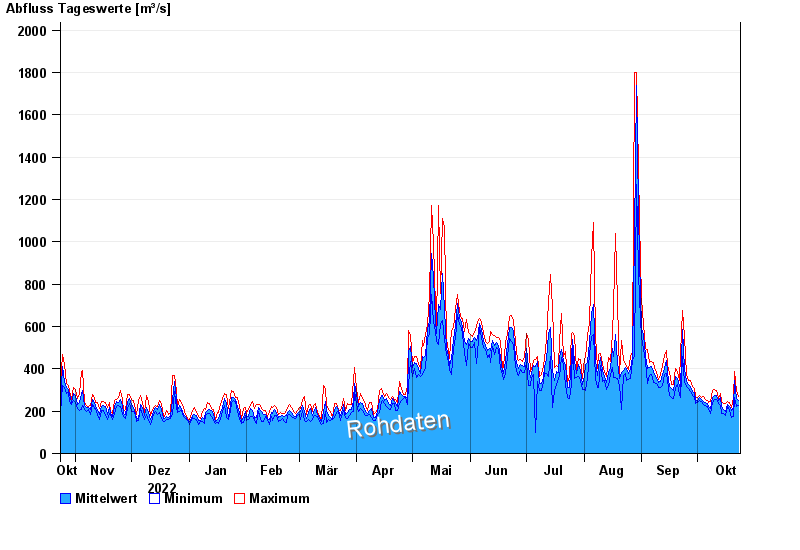
Jahresgrafik Eschelbach Q / Inn
Abfluss vom 24.10.2022 bis zum 23.10.2023
 Für diesen Pegel sind keine Hauptwerte hinterlegt.
| Datum | Mittelwert [m³/s] | Maximum [m³/s] | Minimum [m³/s] |
|---|---|---|---|
| 23.10.2023 | 252 | 271 | 228 |
| 22.10.2023 | 258 | 298 | 221 |
| 21.10.2023 | 343 | 386 | 263 |
| 20.10.2023 | 215 | 264 | 174 |
| 19.10.2023 | 202 | 216 | 170 |
| 18.10.2023 | 224 | 241 | 203 |
| 17.10.2023 | 232 | 244 | 220 |
© Bayerisches Landesamt für Umwelt 2024