
- Startseite >
- Flüsse >
- Abfluss >
- Isar >
- Eschelbach Q >
- Jahresgrafik

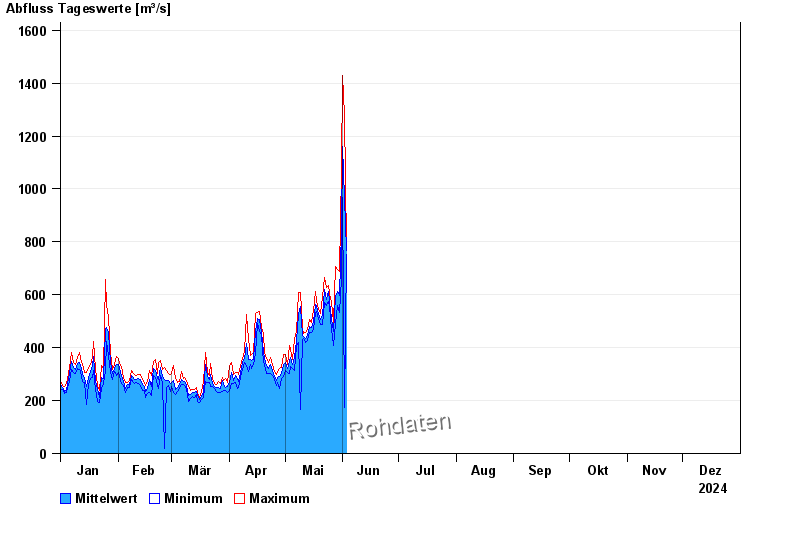
Jahresgrafik Eschelbach Q / Inn
Abfluss vom 01.01.2024 bis zum 31.12.2024
 Für diesen Pegel sind keine Hauptwerte hinterlegt.
| Datum | Mittelwert [m³/s] | Maximum [m³/s] | Minimum [m³/s] |
|---|---|---|---|
| 06.06.2024 | 844 | 856 | 834 |
| 05.06.2024 | 945 | 1010 | 861 |
| 04.06.2024 | 1530 | 1910 | 1020 |
| 03.06.2024 | 1030 | 1600 | 750 |
| 02.06.2024 | 965 | 1280 | 172 |
| 01.06.2024 | 1160 | 1430 | 967 |
| 31.05.2024 | 841 | 1070 | 663 |
© Bayerisches Landesamt für Umwelt 2024