
- Startseite >
- Flüsse >
- Abfluss >
- Inn >
- Stein bei Altenmarkt >
- Jahresgrafik

Jahresgrafik Stein bei Altenmarkt / Traun
Abfluss vom 17.04.2024 bis zum 16.04.2025
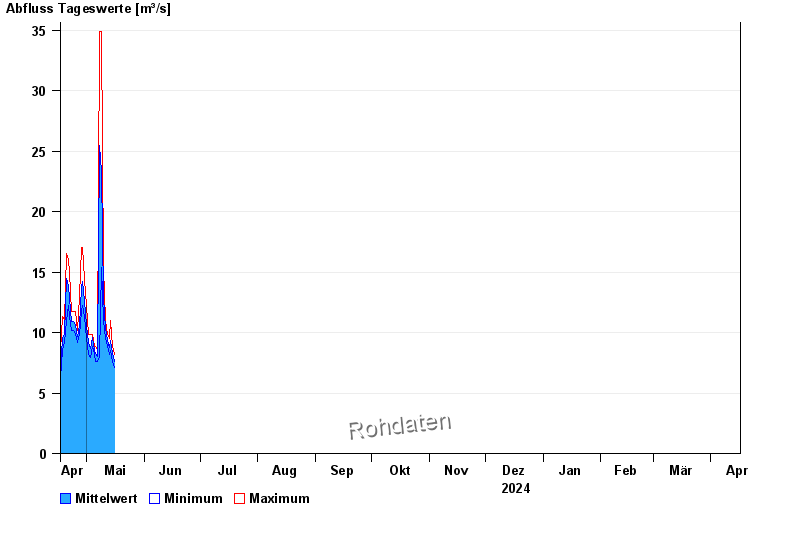
| Datum | Mittelwert [m³/s] | Maximum [m³/s] | Minimum [m³/s] |
|---|---|---|---|
| 29.04.2024 | 14,4 | 17 | 12,2 |
| 28.04.2024 | 13,7 | 17 | 11,7 |
| 27.04.2024 | 10,6 | 13 | 9,81 |
| 26.04.2024 | 9,68 | 10,2 | 9,15 |
| 25.04.2024 | 10,6 | 11,7 | 9,81 |
| 24.04.2024 | 10,9 | 11,7 | 10,2 |
| 23.04.2024 | 10,9 | 11,7 | 10,2 |
© Bayerisches Landesamt für Umwelt 2024