
- Startseite >
- Flüsse >
- Abfluss >
- Inn >
- Eschelbach Q >
- Jahresgrafik

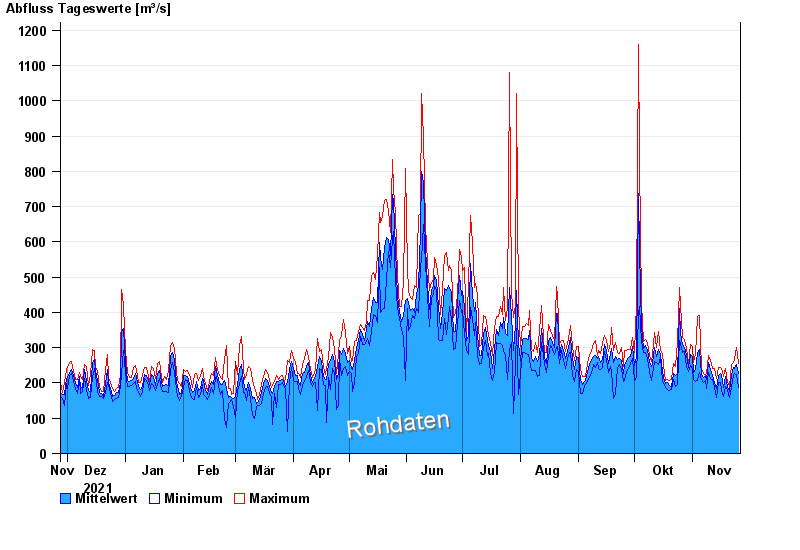
Jahresgrafik Eschelbach Q / Inn
Abfluss vom 27.11.2021 bis zum 26.11.2022
 Für diesen Pegel sind keine -Winter hinterlegt.
| Datum | Mittelwert [m³/s] | Maximum [m³/s] | Minimum [m³/s] |
|---|---|---|---|
| 26.11.2022 | 228 | 255 | 188 |
| 25.11.2022 | 253 | 300 | 224 |
| 24.11.2022 | 242 | 266 | 226 |
| 23.11.2022 | 245 | 257 | 221 |
| 22.11.2022 | 223 | 251 | 188 |
| 21.11.2022 | 176 | 191 | 160 |
| 20.11.2022 | 190 | 200 | 180 |
© Bayerisches Landesamt für Umwelt 2024