
- Startseite >
- Flüsse >
- Abfluss >
- Inn >
- Eschelbach Q >
- Jahresgrafik

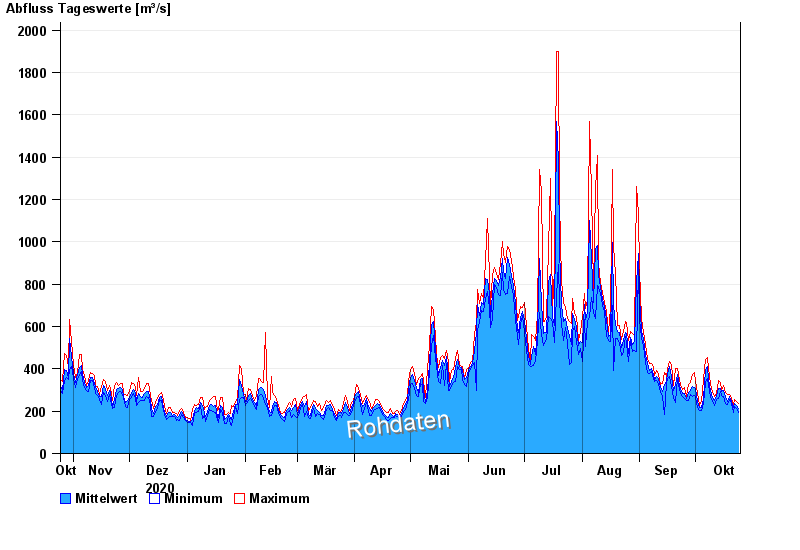
Jahresgrafik Eschelbach Q / Inn
Abfluss vom 25.10.2020 bis zum 24.10.2021
 Für diesen Pegel sind keine Hauptwerte hinterlegt.
| Datum | Mittelwert [m³/s] | Maximum [m³/s] | Minimum [m³/s] |
|---|---|---|---|
| 24.10.2021 | 213 | 234 | 192 |
| 23.10.2021 | 225 | 247 | 213 |
| 22.10.2021 | 238 | 255 | 223 |
| 21.10.2021 | 216 | 233 | 194 |
| 20.10.2021 | 248 | 260 | 235 |
| 19.10.2021 | 268 | 281 | 257 |
| 18.10.2021 | 248 | 277 | 232 |
© Bayerisches Landesamt für Umwelt 2024