
- Startseite >
- Flüsse >
- Abfluss >
- Iller - Lech - Bodensee >
- Seltmans >
- Jahresgrafik

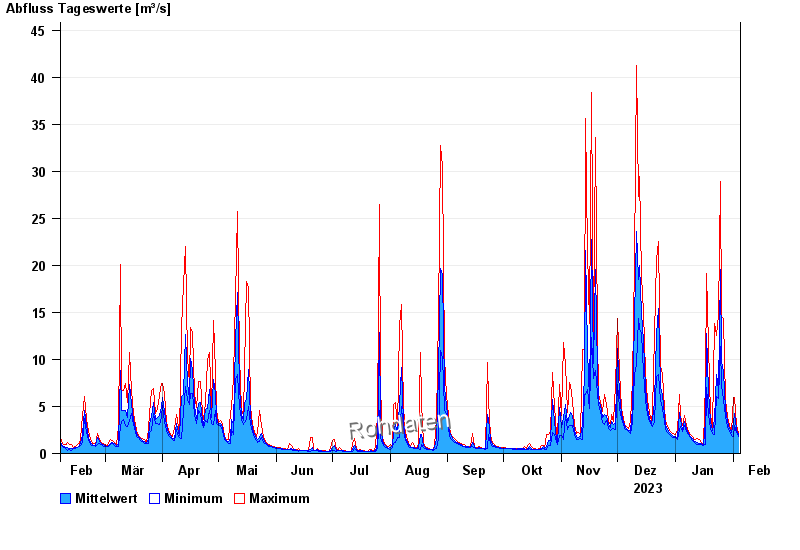
Jahresgrafik Seltmans / Untere Argen
Abfluss vom 05.02.2023 bis zum 04.02.2024
| Datum | Mittelwert [m³/s] | Maximum [m³/s] | Minimum [m³/s] |
|---|---|---|---|
| 04.02.2024 | 2,06 | 2,23 | 1,79 |
| 03.02.2024 | 2,59 | 3,02 | 2,23 |
| 02.02.2024 | 4,23 | 5,93 | 3,02 |
| 01.02.2024 | 3,3 | 5,93 | 1,79 |
| 31.01.2024 | 2,18 | 2,36 | 1,9 |
| 30.01.2024 | 2,64 | 3,02 | 2,36 |
| 29.01.2024 | 3,38 | 3,91 | 2,88 |
© Bayerisches Landesamt für Umwelt 2024