
- Startseite >
- Flüsse >
- Abfluss >
- Iller - Lech - Bodensee >
- Landsberg >
- Monatsgrafik

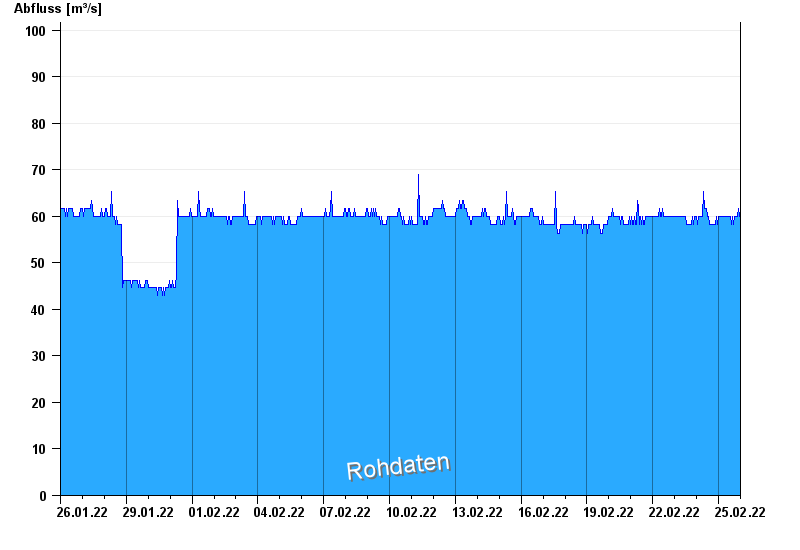
Monatsgrafik Landsberg / Lech
Abfluss vom 26.01.2022 bis zum 25.02.2022
Hinweis
Messwerte beeinflusst durch Kraftwerkssteuerungen.
- 10.08.1970 Abfluss: 1170 m³/s
- 22.05.1999 Abfluss: 1100 m³/s
- 23.08.2005 Abfluss: 987 m³/s
- 13.05.1999 Abfluss: 830 m³/s
- 24.07.1966 Abfluss: 712 m³/s
| Datum | Abfluss [m³/s] |
|---|---|
| 25.02.2022 23:45 | 59,9 |
| 25.02.2022 23:30 | 59,9 |
| 25.02.2022 23:15 | 59,9 |
| 25.02.2022 23:00 | 59,9 |
| 25.02.2022 22:45 | 59,9 |
| 25.02.2022 22:30 | 59,9 |
| 25.02.2022 22:15 | 59,9 |
© Bayerisches Landesamt für Umwelt 2024