
- Startseite >
- Flüsse >
- Abfluss >
- Iller - Lech - Bodensee >
- Gruben >
- Monatsgrafik

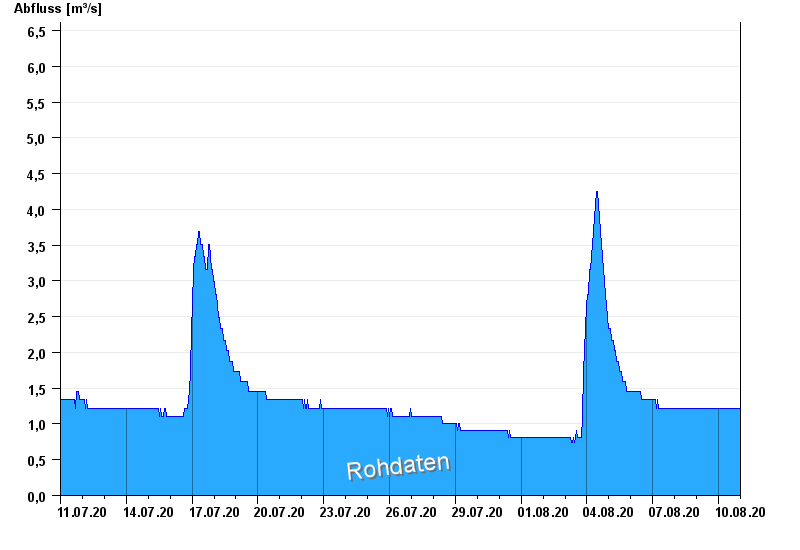
Monatsgrafik Gruben / Oybach
Abfluss vom 11.07.2020 bis zum 10.08.2020
Abflusswerte unsicher
Beeinflussung durch Baumaßnahme
- 22.05.1999 Abfluss: 75,7 m³/s
- 12.08.2002 Abfluss: 35,6 m³/s
- 16.04.1983 Abfluss: 26,5 m³/s
- 01.08.1970 Abfluss: 22,8 m³/s
- 01.08.1960 Abfluss: 21,1 m³/s
| Datum | Abfluss [m³/s] |
|---|---|
| 11.08.2020 00:45 | 1,22 |
| 11.08.2020 00:30 | 1,22 |
| 11.08.2020 00:15 | 1,22 |
| 11.08.2020 00:00 | 1,22 |
| 10.08.2020 23:45 | 1,22 |
| 10.08.2020 23:30 | 1,22 |
| 10.08.2020 23:15 | 1,22 |
© Bayerisches Landesamt für Umwelt 2024