
- Startseite >
- Flüsse >
- Abfluss >
- Iller - Lech - Bodensee >
- Gruben >
- Jahresgrafik

Jahresgrafik Gruben / Oybach
Abfluss vom 30.03.2024 bis zum 29.03.2025
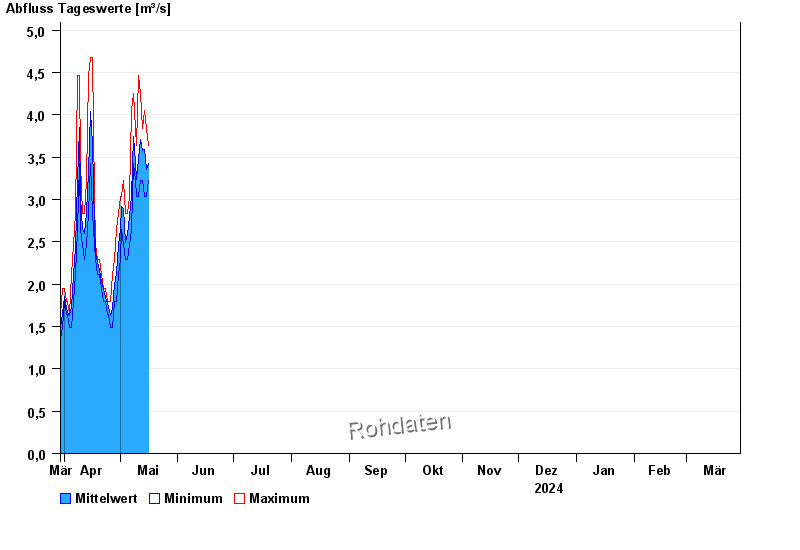
Abflusswerte unsicher
Beeinflussung durch Baumaßnahme
| Datum | Mittelwert [m³/s] | Maximum [m³/s] | Minimum [m³/s] |
|---|---|---|---|
| 29.04.2024 | 1,98 | 2,29 | 1,79 |
| 28.04.2024 | 2 | 2,29 | 1,79 |
| 27.04.2024 | 1,71 | 2,11 | 1,49 |
| 26.04.2024 | 1,63 | 1,79 | 1,49 |
| 25.04.2024 | 1,72 | 1,79 | 1,64 |
| 24.04.2024 | 1,77 | 1,79 | 1,64 |
| 23.04.2024 | 1,84 | 1,95 | 1,79 |
© Bayerisches Landesamt für Umwelt 2024