
- Startseite >
- Flüsse >
- Abfluss >
- Iller - Lech - Bodensee >
- Gruben >
- Jahresgrafik

Jahresgrafik Gruben / Oybach
Abfluss vom 23.10.2022 bis zum 22.10.2023
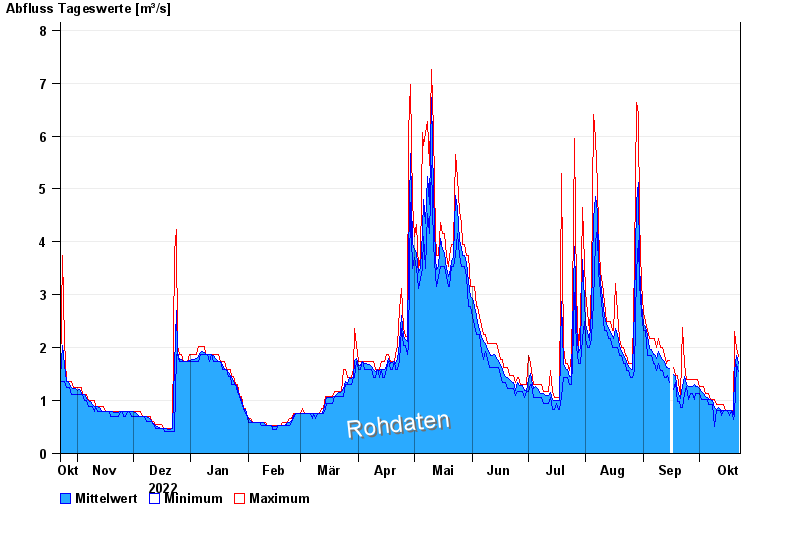
Abflusswerte unsicher
Beeinflussung durch Baumaßnahme
| Datum | Mittelwert [m³/s] | Maximum [m³/s] | Minimum [m³/s] |
|---|---|---|---|
| 22.10.2023 | 1,7 | 1,84 | 1,55 |
| 21.10.2023 | 1,85 | 1,99 | 1,69 |
| 20.10.2023 | 1,57 | 2,3 | 0,719 |
| 19.10.2023 | 0,745 | 0,815 | 0,636 |
| 18.10.2023 | 0,815 | 0,815 | 0,815 |
| 17.10.2023 | 0,806 | 0,815 | 0,719 |
| 16.10.2023 | 0,815 | 0,815 | 0,815 |
© Bayerisches Landesamt für Umwelt 2024