
- Startseite >
- Flüsse >
- Abfluss >
- Iller - Lech - Bodensee >
- Gruben >
- Jahresgrafik

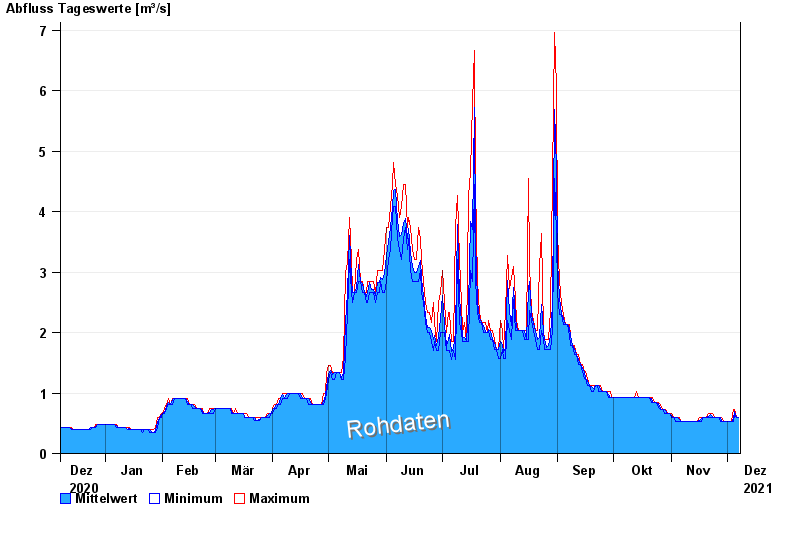
Jahresgrafik Gruben / Oybach
Abfluss vom 08.12.2020 bis zum 07.12.2021
Abflusswerte unsicher
Beeinflussung durch Baumaßnahme
| Datum | Mittelwert [m³/s] | Maximum [m³/s] | Minimum [m³/s] |
|---|---|---|---|
| 07.12.2021 | 0,601 | 0,601 | 0,601 |
| 06.12.2021 | 0,601 | 0,601 | 0,601 |
| 05.12.2021 | 0,691 | 0,734 | 0,647 |
| 04.12.2021 | 0,581 | 0,734 | 0,537 |
| 03.12.2021 | 0,537 | 0,537 | 0,537 |
| 02.12.2021 | 0,537 | 0,537 | 0,537 |
| 01.12.2021 | 0,537 | 0,537 | 0,537 |
© Bayerisches Landesamt für Umwelt 2024