
- Startseite >
- Flüsse >
- Abfluss >
- Iller - Lech - Bodensee >
- Greifenmühle >
- Jahresgrafik

Jahresgrafik Greifenmühle / Rottach
Abfluss vom 20.04.2024 bis zum 19.04.2025
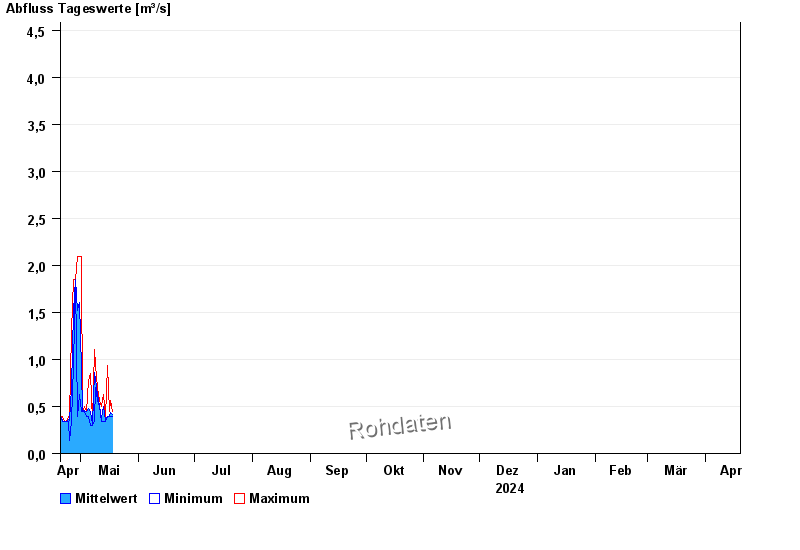
- HQ100 15 m³/s
| Datum | Mittelwert [m³/s] | Maximum [m³/s] | Minimum [m³/s] |
|---|---|---|---|
| 02.05.2024 | 0,443 | 0,443 | 0,443 |
| 01.05.2024 | 0,908 | 2,09 | 0,443 |
| 30.04.2024 | 1,61 | 2,09 | 0,631 |
| 29.04.2024 | 1,52 | 2,09 | 0,389 |
| 28.04.2024 | 1,85 | 1,85 | 1,85 |
| 27.04.2024 | 1,52 | 1,85 | 0,938 |
| 26.04.2024 | 0,704 | 1,3 | 0,339 |
© Bayerisches Landesamt für Umwelt 2024