
- Startseite >
- Flüsse >
- Abfluss >
- Iller - Lech - Bodensee >
- Görisried >
- Jahresgrafik

Jahresgrafik Görisried / Waldbach
Abfluss vom 31.07.2022 bis zum 30.07.2023
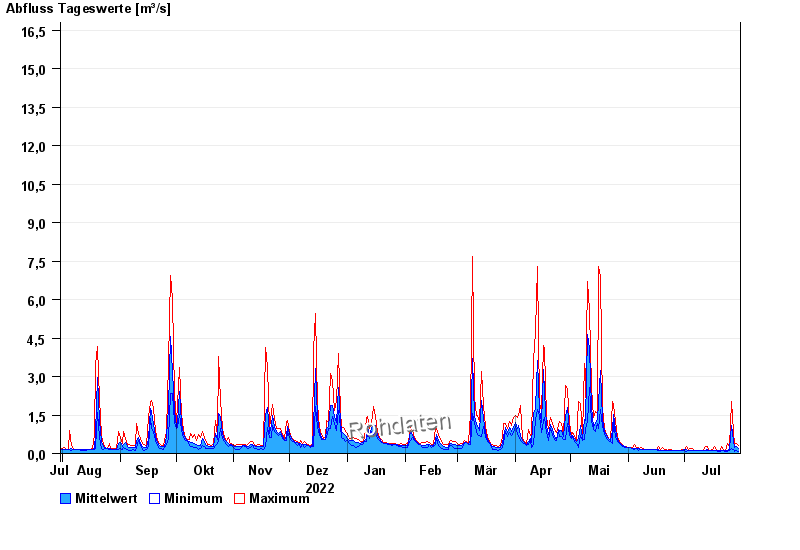
- HQ100 45 m³/s
| Datum | Mittelwert [m³/s] | Maximum [m³/s] | Minimum [m³/s] |
|---|---|---|---|
| 30.07.2023 | 0,198 | 0,311 | 0,079 |
| 29.07.2023 | 0,281 | 0,385 | 0,105 |
| 28.07.2023 | 0,223 | 0,347 | 0,091 |
| 27.07.2023 | 0,479 | 0,868 | 0,142 |
| 26.07.2023 | 1,08 | 2,03 | 0,188 |
| 25.07.2023 | 0,161 | 0,277 | 0,105 |
| 24.07.2023 | 0,113 | 0,385 | 0,091 |
© Bayerisches Landesamt für Umwelt 2024