
- Startseite >
- Flüsse >
- Abfluss >
- Oberer Main - Elbe >
- Untersteinach >
- Jahresgrafik

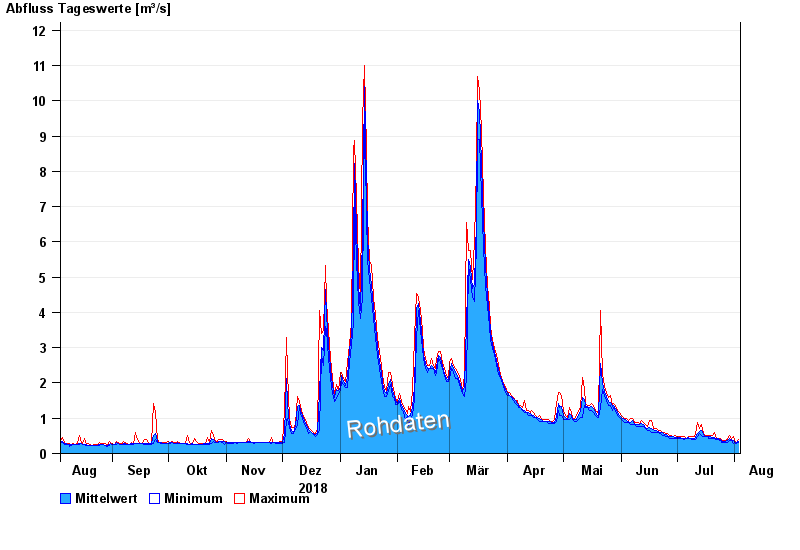
Jahresgrafik Untersteinach / Untere Steinach
Abfluss vom 04.08.2018 bis zum 03.08.2019
| Datum | Mittelwert [m³/s] | Maximum [m³/s] | Minimum [m³/s] |
|---|---|---|---|
| 03.08.2019 | 0,344 | 0,392 | 0,323 |
| 02.08.2019 | 0,31 | 0,323 | 0,292 |
| 01.08.2019 | 0,341 | 0,357 | 0,323 |
| 31.07.2019 | 0,368 | 0,469 | 0,292 |
| 30.07.2019 | 0,393 | 0,434 | 0,358 |
| 29.07.2019 | 0,435 | 0,517 | 0,358 |
| 28.07.2019 | 0,359 | 0,395 | 0,323 |
© Bayerisches Landesamt für Umwelt 2024