
- Startseite >
- Flüsse >
- Abfluss >
- Oberer Main - Elbe >
- Untersteinach >
- Jahresgrafik

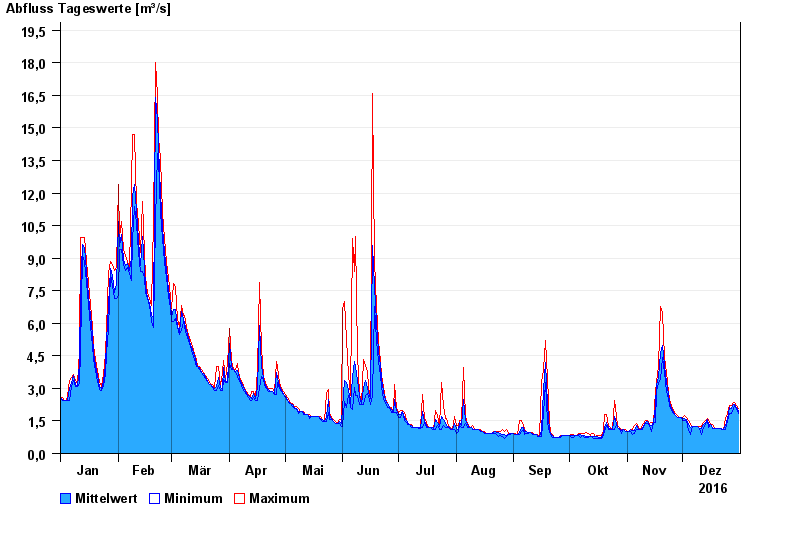
Jahresgrafik Untersteinach / Schorgast
Abfluss vom 01.01.2016 bis zum 31.12.2016
Hinweis
Schlechte Netzanbindung
| Datum | Mittelwert [m³/s] | Maximum [m³/s] | Minimum [m³/s] |
|---|---|---|---|
| 31.12.2016 | 1,93 | 2,08 | 1,84 |
| 30.12.2016 | 2,11 | 2,2 | 2,08 |
| 29.12.2016 | 2,26 | 2,33 | 2,2 |
| 28.12.2016 | 2,26 | 2,33 | 2,08 |
| 27.12.2016 | 2,09 | 2,2 | 1,84 |
| 26.12.2016 | 2,1 | 2,2 | 1,84 |
| 25.12.2016 | 1,61 | 1,84 | 1,51 |
© Bayerisches Landesamt für Umwelt 2024