
- Startseite >
- Flüsse >
- Abfluss >
- Oberer Main - Elbe >
- Fahrenbühl >
- Jahresgrafik

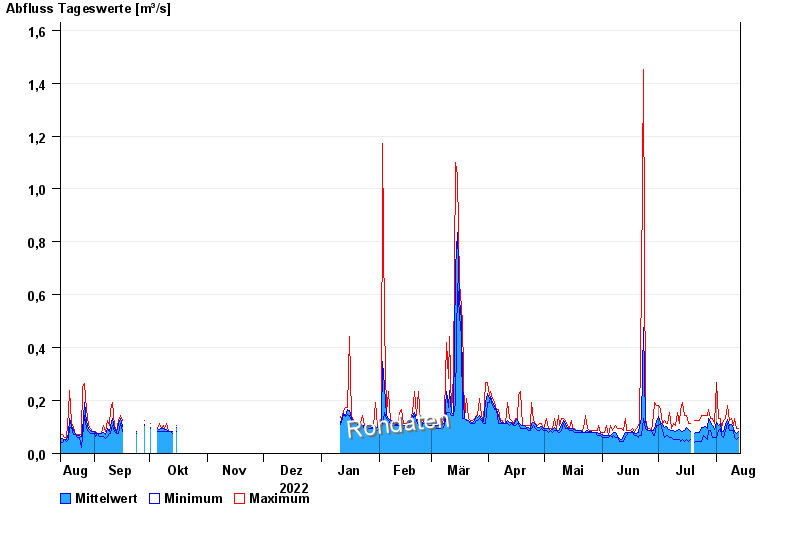
Jahresgrafik Fahrenbühl / Lamitz
Abfluss vom 14.08.2022 bis zum 13.08.2023
Hinweis
Schlechte Netzanbindung
| Datum | Mittelwert [m³/s] | Maximum [m³/s] | Minimum [m³/s] |
|---|---|---|---|
| 13.08.2023 | 0,083 | 0,096 | 0,06 |
| 12.08.2023 | 0,076 | 0,096 | 0,052 |
| 11.08.2023 | 0,084 | 0,134 | 0,06 |
| 10.08.2023 | 0,093 | 0,105 | 0,087 |
| 09.08.2023 | 0,109 | 0,134 | 0,087 |
| 08.08.2023 | 0,104 | 0,124 | 0,087 |
| 07.08.2023 | 0,128 | 0,181 | 0,115 |
© Bayerisches Landesamt für Umwelt 2024