
- Startseite >
- Flüsse >
- Abfluss >
- Bayern >
- Sylvensteinsee Gesamtzufluss >
- Jahresgrafik

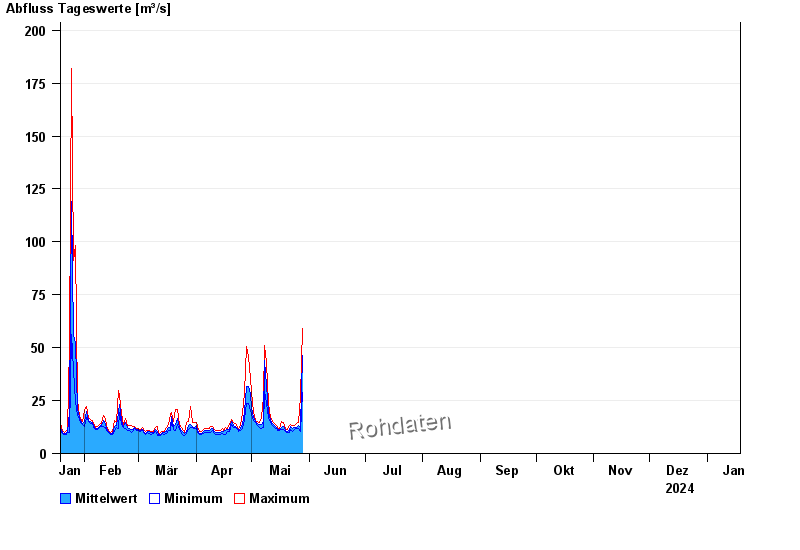
Jahresgrafik Sylvensteinsee Gesamtzufluss / Sylvensteinsee
Abfluss vom 19.01.2024 bis zum 18.01.2025
 Für diesen Pegel sind keine Hauptwerte hinterlegt.
| Datum | Mittelwert [m³/s] | Maximum [m³/s] | Minimum [m³/s] |
|---|---|---|---|
| 07.05.2024 | 14,2 | 14,7 | 13,6 |
| 06.05.2024 | 13,9 | 17,2 | 12 |
| 05.05.2024 | 13,5 | 14,6 | 12,4 |
| 04.05.2024 | 14,4 | 15,2 | 13,4 |
| 03.05.2024 | 15 | 15,8 | 14,5 |
| 02.05.2024 | 16,9 | 19,2 | 15,6 |
| 01.05.2024 | 21,6 | 29,2 | 18,4 |
© Bayerisches Landesamt für Umwelt 2024