
- Startseite >
- Flüsse >
- Abfluss >
- Bayern >
- Schweinfurt Neuer Hafen >
- Jahresgrafik

Jahresgrafik Schweinfurt Neuer Hafen / Main
Abfluss vom 01.01.2024 bis zum 28.04.2024
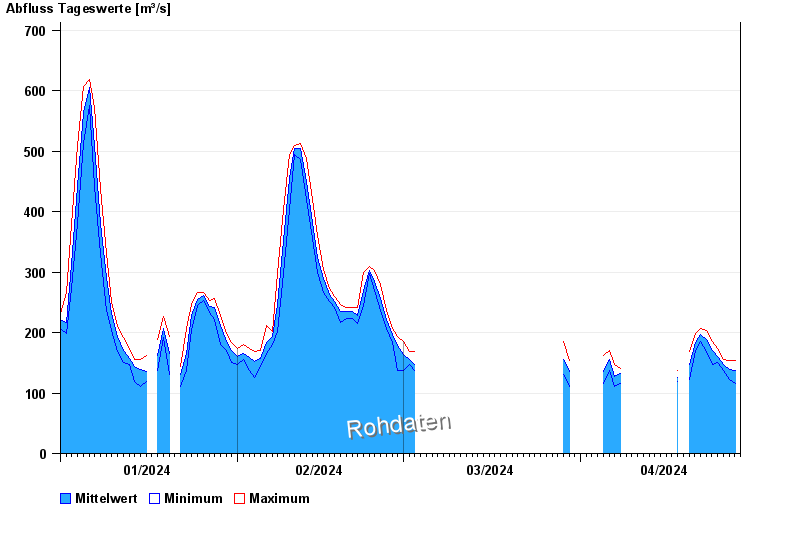
| Datum | Mittelwert [m³/s] | Maximum [m³/s] | Minimum [m³/s] |
|---|---|---|---|
| 28.04.2024 | 140 | 150 | 115 |
| 27.04.2024 | 139 | 153 | 122 |
| 26.04.2024 | 147 | 156 | 137 |
| 25.04.2024 | 160 | 174 | 150 |
| 24.04.2024 | 170 | 185 | 147 |
| 23.04.2024 | 189 | 204 | 168 |
| 22.04.2024 | 197 | 207 | 185 |
© Bayerisches Landesamt für Umwelt 2024