
- Startseite >
- Flüsse >
- Abfluss >
- Bayern >
- Rötz Speicherzufluss >
- Jahresgrafik

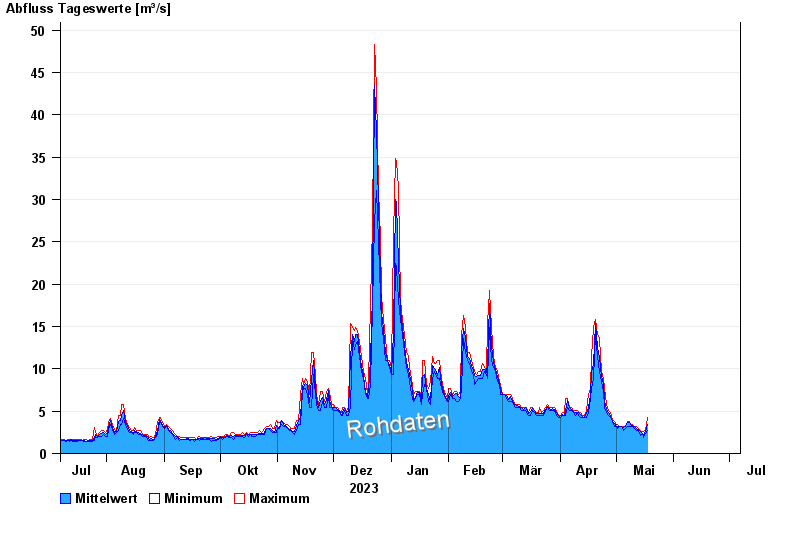
Jahresgrafik Rötz Speicherzufluss / Schwarzach
Abfluss vom 07.07.2023 bis zum 06.07.2024
| Datum | Mittelwert [m³/s] | Maximum [m³/s] | Minimum [m³/s] |
|---|---|---|---|
| 19.05.2024 | 4,92 | 4,92 | 4,92 |
| 18.05.2024 | 3,7 | 4,61 | 2,75 |
| 17.05.2024 | 2,57 | 2,75 | 2,32 |
| 16.05.2024 | 2,25 | 2,54 | 1,94 |
| 15.05.2024 | 2,32 | 2,54 | 2,32 |
| 14.05.2024 | 2,54 | 2,75 | 2,13 |
| 13.05.2024 | 2,84 | 2,98 | 2,75 |
© Bayerisches Landesamt für Umwelt 2024