
- Startseite >
- Flüsse >
- Abfluss >
- Bayern >
- Lohma Q >
- Jahresgrafik

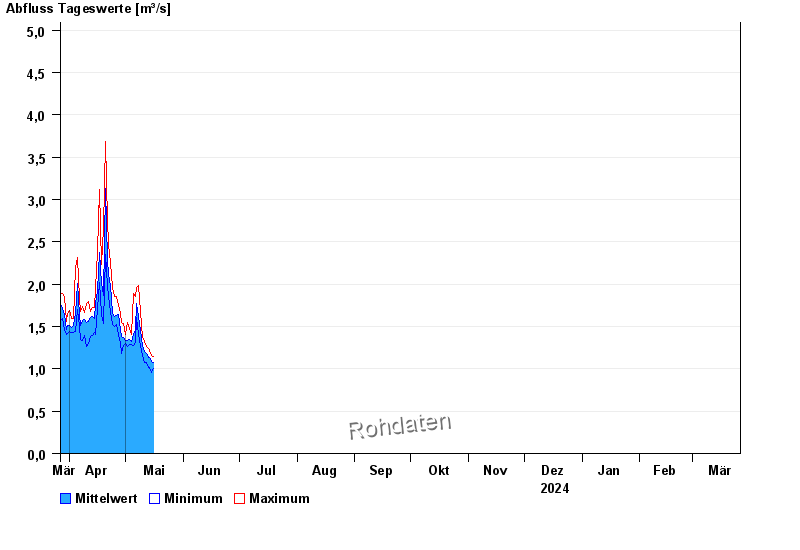
Jahresgrafik Lohma Q / Zottbach
Abfluss vom 27.03.2024 bis zum 26.03.2025
 Für diesen Pegel sind keine historische Ereignisse hinterlegt.
Hinweis
Abflusswerte sind Werte der Ultraschallanlage!
| Datum | Mittelwert [m³/s] | Maximum [m³/s] | Minimum [m³/s] |
|---|---|---|---|
| 26.03.2025 | 1,42 | 1,55 | 1,2 |
| 25.03.2025 | 1,43 | 1,53 | 1,17 |
| 24.03.2025 | 1,38 | 1,53 | 1,23 |
| 23.03.2025 | 1,28 | 1,37 | 1,12 |
| 22.03.2025 | 1,27 | 1,37 | 1,15 |
| 21.03.2025 | 1,28 | 1,52 | 1,15 |
| 20.03.2025 | 1,26 | 1,32 | 1,18 |
© Bayerisches Landesamt für Umwelt 2025