
- Startseite >
- Flüsse >
- Abfluss >
- Bayern >
- Gruben >
- Jahresgrafik

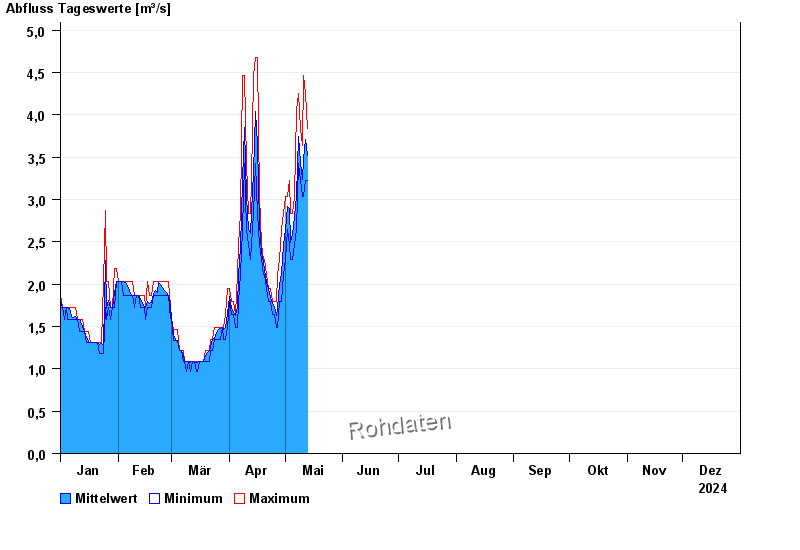
Jahresgrafik Gruben / Oybach
Abfluss vom 01.01.2024 bis zum 31.12.2024
| Datum | Mittelwert [m³/s] | Maximum [m³/s] | Minimum [m³/s] |
|---|---|---|---|
| 31.12.2024 | 0,668 | 0,749 | 0,501 |
| 30.12.2024 | 0,67 | 0,749 | 0,501 |
| 29.12.2024 | 0,663 | 0,749 | 0,501 |
| 28.12.2024 | 0,657 | 0,749 | 0,501 |
| 27.12.2024 | 0,665 | 0,749 | 0,501 |
| 26.12.2024 | 0,66 | 0,749 | 0,501 |
| 25.12.2024 | 0,662 | 0,664 | 0,501 |
© Bayerisches Landesamt für Umwelt 2025