
- Startseite >
- Flüsse >
- Abfluss >
- Bayern >
- Eschelbach Q >
- Jahresgrafik

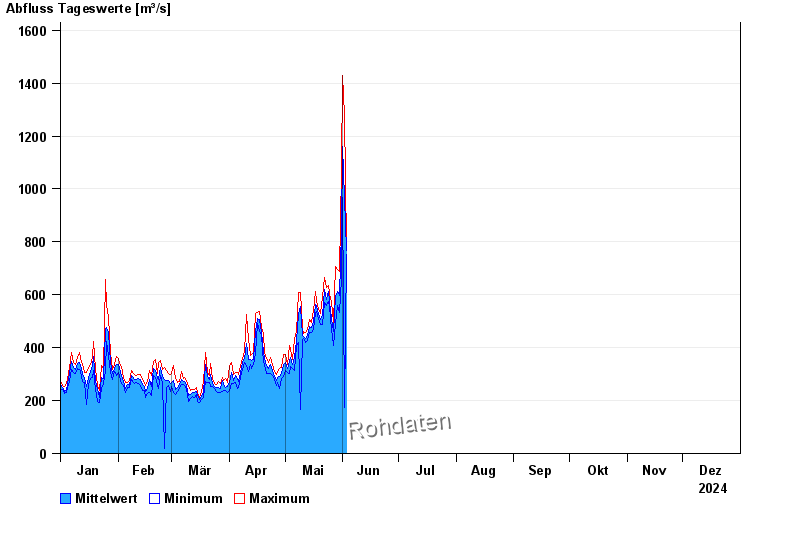
Jahresgrafik Eschelbach Q / Inn
Abfluss vom 01.01.2024 bis zum 31.12.2024
 Für diesen Pegel sind keine Hauptwerte hinterlegt.
| Datum | Mittelwert [m³/s] | Maximum [m³/s] | Minimum [m³/s] |
|---|---|---|---|
| 31.05.2024 | 669 | 688 | 663 |
| 30.05.2024 | 596 | 689 | 532 |
| 29.05.2024 | 614 | 696 | 558 |
| 28.05.2024 | 592 | 706 | 490 |
| 27.05.2024 | 462 | 497 | 408 |
| 26.05.2024 | 512 | 572 | 469 |
| 25.05.2024 | 576 | 606 | 555 |
© Bayerisches Landesamt für Umwelt 2024