
- Start >
- Rivers >
- Waterlevel >
- Regnitz >
- Trunstadt >
- Chart of year

Chart of year Trunstadt / Main
Waterlevel from 07.03.2021 to 06.03.2022
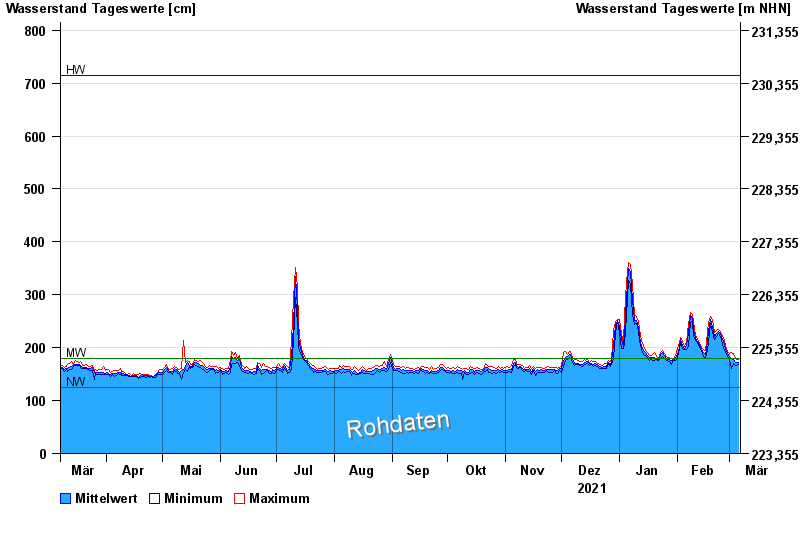
| Date | Mean value [cm] | Maximum [cm] | Minimum [cm] |
|---|---|---|---|
| 06.03.2022 | 172 | 177 | 169 |
| 05.03.2022 | 172 | 177 | 166 |
| 04.03.2022 | 174 | 184 | 168 |
| 03.03.2022 | 177 | 189 | 170 |
| 02.03.2022 | 180 | 190 | 161 |
| 01.03.2022 | 184 | 189 | 178 |
| 28.02.2022 | 189 | 193 | 184 |
© Bayerisches Landesamt für Umwelt 2024