
- Start >
- Rivers >
- Waterlevel >
- Regnitz >
- Trunstadt >
- Chart of total period

Chart of total period Trunstadt / Main
Waterlevel from 01.11.1975 to 24.04.2024
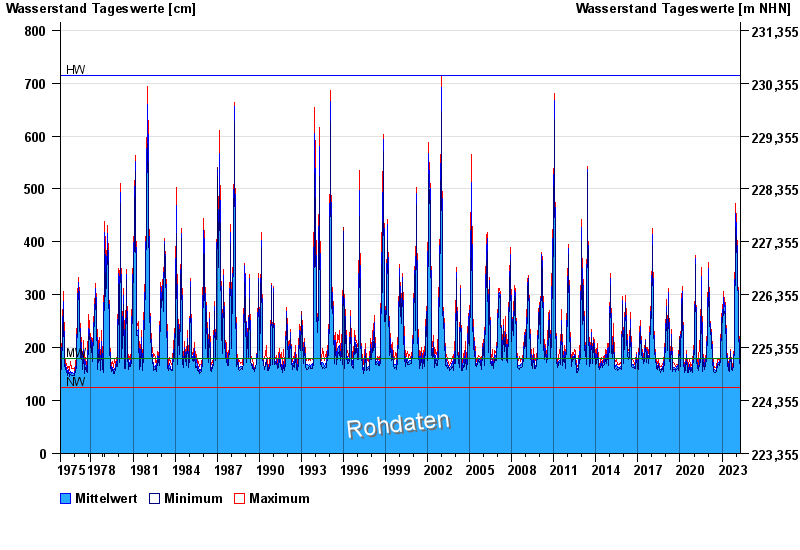
| Date | Mean value [cm] | Maximum [cm] | Minimum [cm] |
|---|---|---|---|
| 24.04.2024 | 173 | 176 | 169 |
| 23.04.2024 | 176 | 181 | 167 |
| 22.04.2024 | 182 | 188 | 175 |
| 21.04.2024 | 173 | 175 | 167 |
| 20.04.2024 | 163 | 168 | 151 |
| 19.04.2024 | 149 | 151 | 144 |
| 18.04.2024 | 150 | 155 | 145 |
© Bayerisches Landesamt für Umwelt 2024