
- Start >
- Rivers >
- Waterlevel >
- Regnitz >
- Schnaittach Markt >
- Chart of total period

Chart of total period Schnaittach Markt / Schnaittach
Waterlevel from 01.11.1969 to 23.04.2024
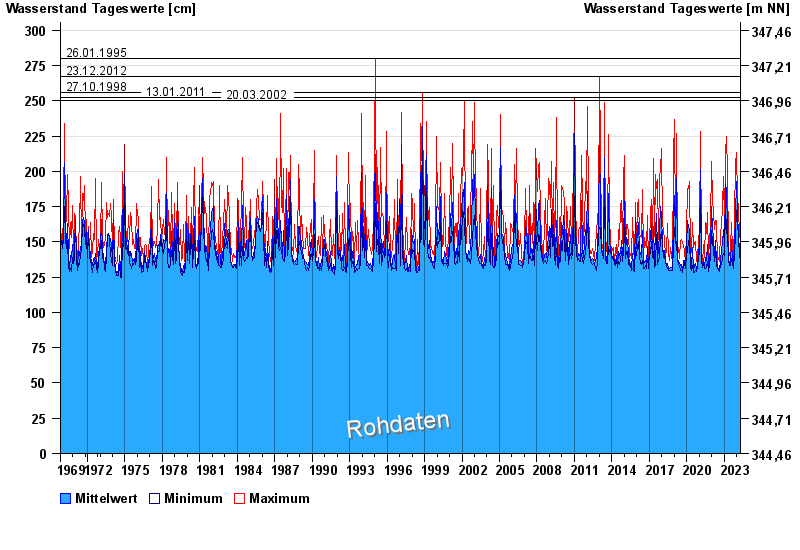
- 26.01.1995 Wasserstand: 280 cm
- 23.12.2012 Wasserstand: 267 cm
- 27.10.1998 Wasserstand: 256 cm
- 13.01.2011 Wasserstand: 252 cm
- 20.03.2002 Wasserstand: 250 cm
| Date | Mean value [cm] | Maximum [cm] | Minimum [cm] |
|---|---|---|---|
| 23.04.2024 | 141 | 142 | 140 |
| 22.04.2024 | 143 | 148 | 139 |
| 21.04.2024 | 148 | 158 | 137 |
| 20.04.2024 | 144 | 154 | 137 |
| 19.04.2024 | 142 | 158 | 136 |
| 18.04.2024 | 136 | 136 | 136 |
| 17.04.2024 | 136 | 137 | 136 |
© Bayerisches Landesamt für Umwelt 2024