
- Start >
- Rivers >
- Waterlevel >
- Regnitz >
- Schnaittach Markt >
- Chart of total period

Chart of total period Schnaittach Markt / Schnaittach
Waterlevel from 01.11.1969 to 19.04.2024
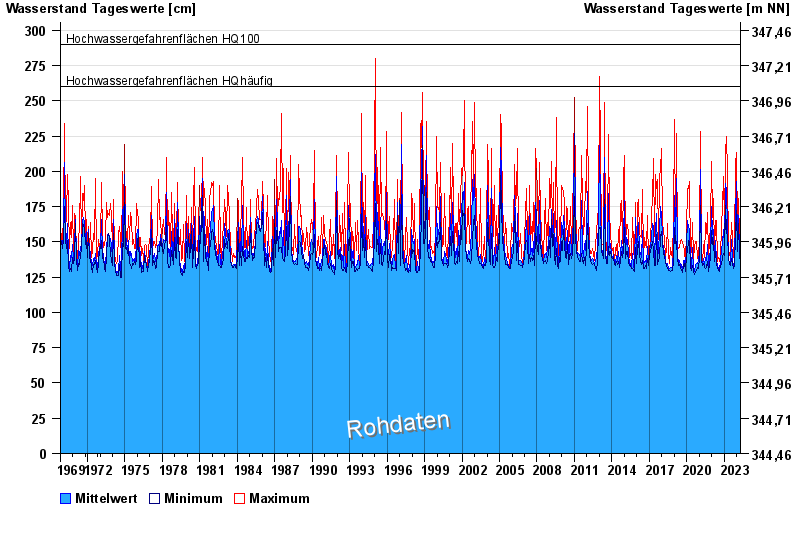
- Hochwassergefahrenfläche HQhäufig 260 cm
- Hochwassergefahrenfläche HQ100 290 cm
| Date | Mean value [cm] | Maximum [cm] | Minimum [cm] |
|---|---|---|---|
| 19.04.2024 | 136 | 136 | 136 |
| 18.04.2024 | 136 | 136 | 136 |
| 17.04.2024 | 136 | 137 | 136 |
| 16.04.2024 | 136 | 138 | 136 |
| 15.04.2024 | 136 | 137 | 136 |
| 14.04.2024 | 136 | 137 | 136 |
| 13.04.2024 | 136 | 137 | 136 |
© Bayerisches Landesamt für Umwelt 2024