
- Start >
- Rivers >
- Waterlevel >
- Regnitz >
- Michelfeld >
- Chart of total period

Chart of total period Michelfeld / Pegnitz
Waterlevel from 01.11.1969 to 19.04.2024
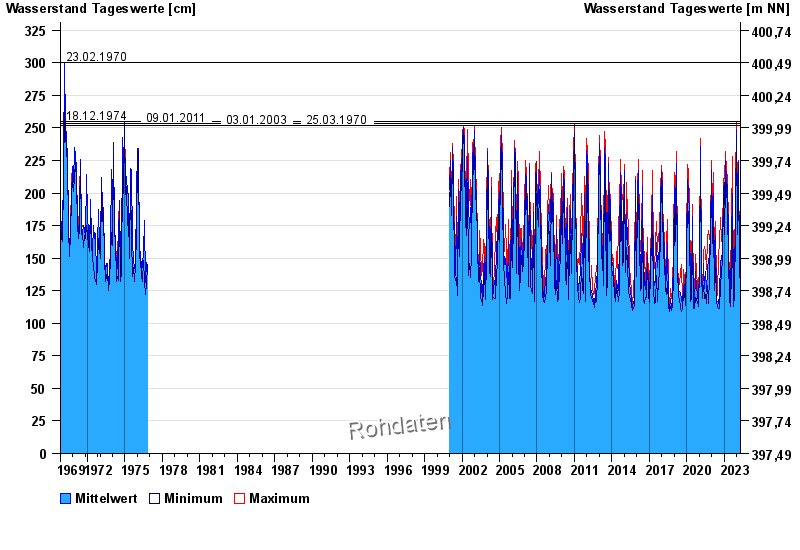
- 23.02.1970 Wasserstand: 300 cm
- 18.12.1974 Wasserstand: 255 cm
- 09.01.2011 Wasserstand: 253 cm
- 03.01.2003 Wasserstand: 252 cm
- 25.03.1970 Wasserstand: 252 cm
| Date | Mean value [cm] | Maximum [cm] | Minimum [cm] |
|---|---|---|---|
| 19.04.2024 | 133 | 135 | 132 |
| 18.04.2024 | 136 | 139 | 133 |
| 17.04.2024 | 137 | 146 | 133 |
| 16.04.2024 | 126 | 151 | 120 |
| 15.04.2024 | 120 | 121 | 120 |
| 14.04.2024 | 121 | 121 | 120 |
| 13.04.2024 | 121 | 122 | 121 |
© Bayerisches Landesamt für Umwelt 2024