
- Start >
- Rivers >
- Waterlevel >
- Regnitz >
- Lauf >
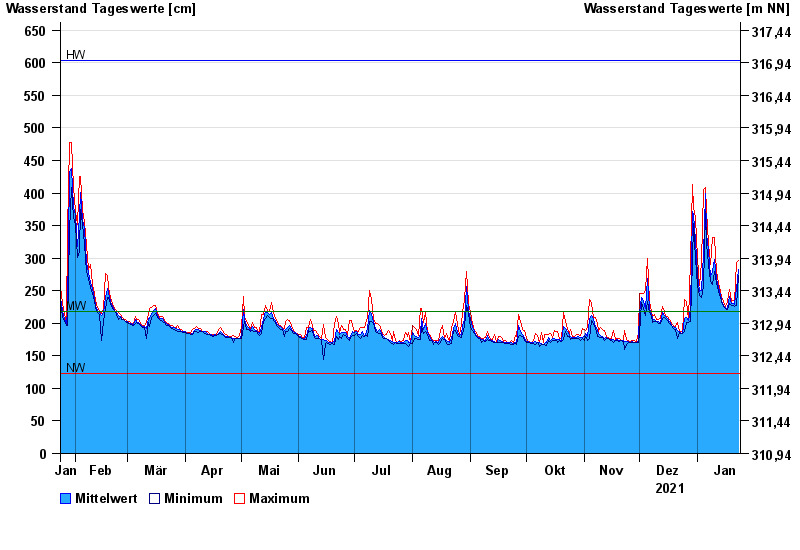
- Chart of year

Chart of year Lauf / Pegnitz
Waterlevel from 24.01.2021 to 23.01.2022
| Date | Mean value [cm] | Maximum [cm] | Minimum [cm] |
|---|---|---|---|
| 23.01.2022 | 283 | 296 | 273 |
| 22.01.2022 | 253 | 293 | 228 |
| 21.01.2022 | 229 | 233 | 226 |
| 20.01.2022 | 231 | 235 | 227 |
| 19.01.2022 | 230 | 233 | 227 |
| 18.01.2022 | 241 | 252 | 230 |
| 17.01.2022 | 222 | 233 | 221 |
© Bayerisches Landesamt für Umwelt 2024