
- Start >
- Rivers >
- Waterlevel >
- Regnitz >
- Lauf >
- Chart of year

Chart of year Lauf / Pegnitz
Waterlevel from 15.07.2021 to 14.07.2022
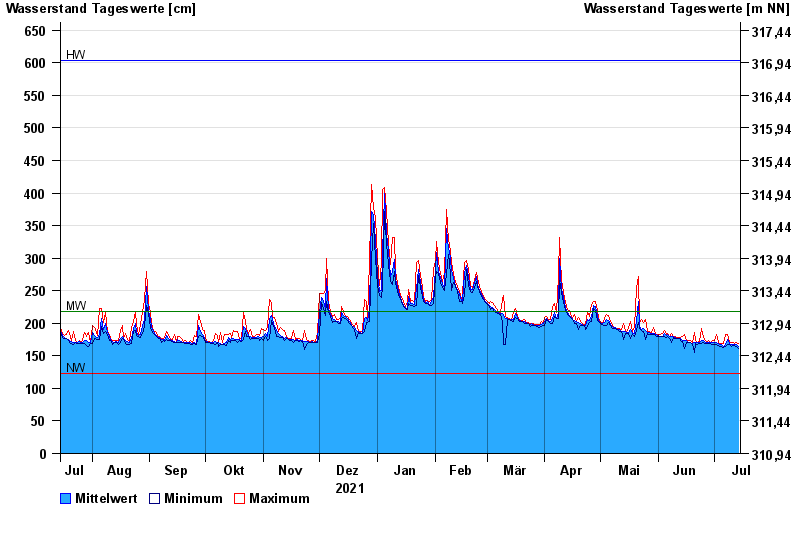
| Date | Mean value [cm] | Maximum [cm] | Minimum [cm] |
|---|---|---|---|
| 14.07.2022 | 165 | 169 | 161 |
| 13.07.2022 | 167 | 170 | 165 |
| 12.07.2022 | 168 | 169 | 166 |
| 11.07.2022 | 168 | 170 | 166 |
| 10.07.2022 | 168 | 170 | 165 |
| 09.07.2022 | 169 | 170 | 167 |
| 08.07.2022 | 175 | 182 | 167 |
© Bayerisches Landesamt für Umwelt 2024