
- Start >
- Rivers >
- Waterlevel >
- Regnitz >
- Lauf >
- Chart of year

Chart of year Lauf / Pegnitz
Waterlevel from 01.01.2021 to 31.12.2021
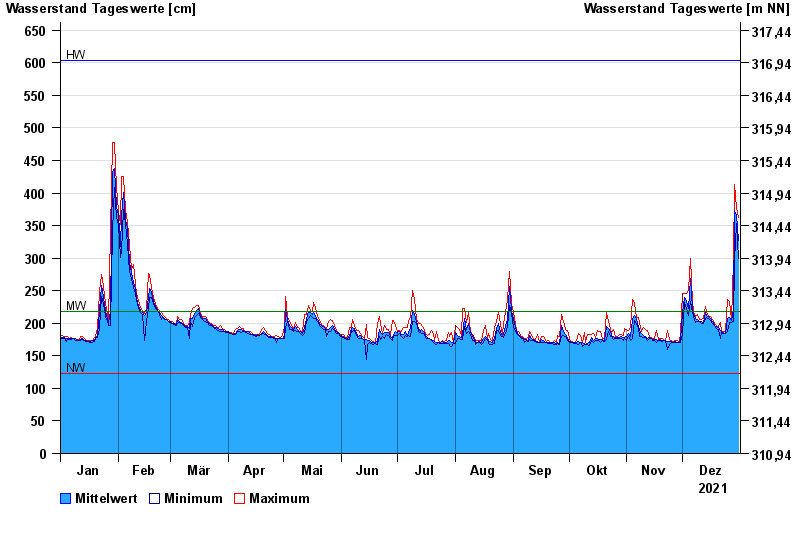
| Date | Mean value [cm] | Maximum [cm] | Minimum [cm] |
|---|---|---|---|
| 31.12.2021 | 327 | 363 | 299 |
| 30.12.2021 | 367 | 378 | 353 |
| 29.12.2021 | 371 | 413 | 297 |
| 28.12.2021 | 221 | 297 | 202 |
| 27.12.2021 | 204 | 206 | 201 |
| 26.12.2021 | 209 | 233 | 201 |
| 25.12.2021 | 208 | 236 | 187 |
© Bayerisches Landesamt für Umwelt 2024