
- Start >
- Rivers >
- Waterlevel >
- Regnitz >
- Lauf >
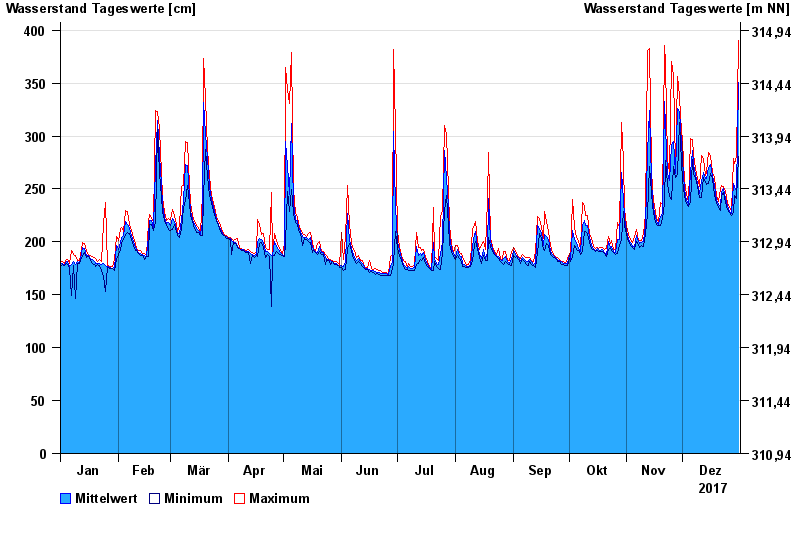
- Chart of year

Chart of year Lauf / Pegnitz
Waterlevel from 01.01.2017 to 31.12.2017
| Date | Mean value [cm] | Maximum [cm] | Minimum [cm] |
|---|---|---|---|
| 31.12.2017 | 351 | 390 | 281 |
| 30.12.2017 | 248 | 281 | 241 |
| 29.12.2017 | 252 | 274 | 244 |
| 28.12.2017 | 255 | 279 | 228 |
| 27.12.2017 | 227 | 229 | 225 |
| 26.12.2017 | 229 | 232 | 228 |
| 25.12.2017 | 234 | 237 | 231 |
© Bayerisches Landesamt für Umwelt 2024